Introduction
Most dangerous gas leaks in upstream oil and gas operations are completely invisible. Methane, volatile organic compounds (VOCs), and associated hydrocarbons escape from wellsite equipment at ambient pressure without color, odor, or sound — making conventional walk-around inspections largely reactive and unreliable by design.
Clean Air Act civil penalties now reach $124,426 per day per violation for penalties assessed on or after January 8, 2025. The EPA's 2024 methane standards are projected to recover natural gas valued at $7.4 to $13 billion through 2038 — gas that currently escapes undetected between quarterly inspection visits.
Add ESG investor scrutiny and OGMP 2.0 reporting obligations, and operators facing that exposure need detection methods that work continuously — not just on inspection day.
This guide covers how IR cameras detect gas leaks, which camera types suit upstream O&G environments, where on a wellsite they're deployed, and what continuous autonomous monitoring offers that periodic leak detection and repair (LDAR) snapshots cannot.
Key Takeaways
- Infrared optical gas imaging (OGI) cameras detect methane and VOC plumes invisible to the naked eye across entire wellsites without physical contact
- LWIR cameras cost roughly one-third of traditional cooled MWIR systems and operate 24/7 in day and night conditions
- Wellheads, tank hatches, compressors, pneumatic controllers, and flowline connections are all detectable with properly selected IR cameras
- Continuous monitoring catches emissions that periodic LDAR inspections miss between scheduled visits
- EPA rules recognize OGI as a prescribed survey method and provide a separate approval process for advanced monitoring technologies
How Infrared Cameras Detect Gas Leaks in Oil and Gas Operations
The Core Physics
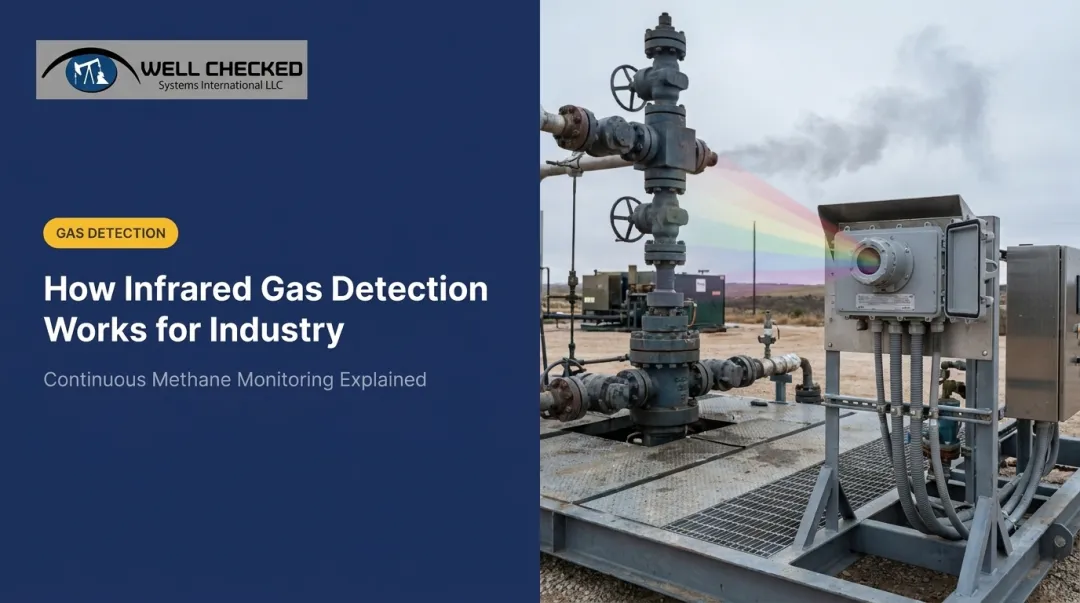
Every gas molecule absorbs infrared radiation at specific wavelengths — its spectral fingerprint. OGI cameras are spectrally filtered to match those absorption bands. When a target gas passes in front of the detector, it absorbs IR energy and renders as a dark, moving plume against a warmer background, giving operators a real-time visual of an otherwise undetectable release.
This is fundamentally different from a standard thermal camera. A conventional thermal camera detects surface temperature differences — useful for electrical faults, pipe insulation failures, or hot-water leaks. An OGI camera is tuned to those same wavelengths where target gases absorb IR energy, rendering specific gas clouds as visible imagery. A general-purpose thermal imager and a dedicated OGI camera are both infrared instruments, but they answer completely different questions.

What the Operator Sees
The gas plume appears as a dark, smoke-like cloud in real time. This allows the technician — or an automated system — to:
- Pinpoint the emission source within the equipment assembly
- Assess plume direction and estimate severity
- Monitor without entering the hazardous zone or halting production
Detection Sensitivity Factors
Sensitivity isn't fixed. Several variables affect whether a camera detects a given leak:
- Gas concentration and leak rate — lower flow rates produce fainter plumes
- Wind speed — higher winds dilute and disperse plumes, reducing contrast
- Ambient temperature differential — a larger temperature difference between the gas and background improves contrast
- Camera distance — performance degrades at longer standoff distances
EPA Appendix K sets the regulatory floor: cameras must detect methane at 19 g/hr, and either butane at 29 g/hr or propane at 22 g/hr, demonstrated at 2 meters with a 5°C delta-T and wind speeds of 1 m/s or less.
In controlled lab conditions, cooled OGI cameras have demonstrated methane detection limits well under 1 g/hr at 2 meters with only a 2°C delta-T — an order of magnitude below the EPA threshold. Field conditions, however, rarely resemble the lab, which is why standoff distance, wind, and background contrast matter more in practice than headline sensitivity figures.
Background Contrast: The Overlooked Best Practice
Background contrast is the variable most often overlooked in the field. Operators and automated systems must position cameras so the gas plume passes against a thermally distinct background — open sky, metal equipment surfaces, or a warm exhaust stack. A plume against a thermally uniform background disappears entirely. Camera placement isn't a secondary concern; it directly determines whether a leak is visible at all.
MWIR vs. LWIR: Choosing the Right Infrared Camera for Oil and Gas Leak Detection
Camera selection in upstream O&G comes down to one core trade-off: sensitivity and regulatory pedigree vs. cost and deployment flexibility. Both bands have a legitimate place in a monitoring program — the right choice depends on your gas targets, compliance pathway, and deployment model.
Mid-Wave Infrared (MWIR): The Traditional OGI Standard
MWIR cameras operate in the 3–5 µm spectral band using cooled detector systems. They are the established standard for OGI in regulatory programs.
Advantages:
- High sensitivity, capable of detecting smaller leak rates at longer distances
- Established use in EPA OGI work practices when the applicable camera, survey, and recordkeeping requirements are met
- Strong performance for methane, whose primary absorption band sits at ~3.3 µm
- Typical cooled MWIR units detect a broad set of hydrocarbon species, including methane, benzene, ethane, propane, and toluene
Limitations:
- Higher capital cost — approximately 3× the cost of LWIR alternatives
- Cryogenic cooling systems add maintenance complexity and downtime risk
- Larger form factor limits fixed-mount deployment density
Long-Wave Infrared (LWIR): The Cost-Effective Alternative
LWIR cameras operate in the 8–14 µm band using uncooled microbolometer detectors. They eliminate the cryogenic cooling requirement entirely.
Key distinctions:
- Available at a substantially lower cost than comparable cooled MWIR systems, based on Well Checked's platform documentation
- Better suited for CO₂, SF₆, and some VOCs whose stronger absorption features fall in the LWIR band
- Typical uncooled LWIR units operate in a 7–8.5 µm passband covering methane, propane, and select industrial gases
Methane's primary absorption band is in the MWIR range, but it does have LWIR absorption features. Advances in uncooled detector sensitivity and AI-assisted plume analysis have expanded LWIR applicability for upstream O&G monitoring — a nuance that many equipment buyers overlook when comparing systems on spec sheets alone. Well Checked has a USPTO provisional patent filing for Detecting and Quantifying Fugitive Methane and Vapor Emissions Using Infrared Imaging and Machine Learning.

Once you've identified the right spectral band, the next decision is how you deploy the camera in the field.
Deployment Form Factors
| Form Factor | Best Use Case | Trade-Off |
|---|---|---|
| Handheld OGI | Route-based LDAR inspections by certified technicians | Coverage limited to inspection schedule |
| Fixed-mount | 24/7 autonomous monitoring at specific equipment clusters | Higher per-site hardware cost |
| Drone-mounted | Rapid coverage of large acreage or midstream pipelines | Regulatory documentation complexity |
Camera Selection Criteria
Before specifying any OGI camera for an O&G wellsite, evaluate:
- NETD (thermal sensitivity) — determines minimum detectable leak rate
- Operating temperature range — critical for Bakken, Appalachian, or other cold-weather basins
- Ingress protection (IP) rating — dust and water resistance for oilfield conditions
- Data output compatibility — does the camera feed into downstream compliance and reporting workflows automatically?
Where Infrared Cameras Are Used Across the Oil and Gas Wellsite
Wellheads and Christmas Trees
Packing glands, valve stems, and tubing connections are classic fugitive emission points. An OGI camera scans the entire wellhead assembly in seconds from a safe standoff distance, identifying which specific component is leaking — without the technician making direct contact with each potential point. A handheld contact sensor requires proximity to every possible source — one scan replaces that entire circuit.
Storage Tank Hatches
Open or improperly sealed thief hatches on production tanks are among the largest single-source emission events in upstream O&G. IR cameras detect vapor releases during tank gauging operations and working/breathing losses even when hatches appear visually closed. The hatch looks fine. The plume tells a different story.
Compressor Stations and Pneumatic Controllers
Reciprocating and centrifugal compressors have multiple potential leak points: rod packing, seals, and flanges. Pneumatic controllers vent gas by design — but malfunctioning high-bleed pneumatics release significant unintended volumes.
According to EPA emissions data, a single compressor station vicinity concentrates three of the largest upstream emission categories:
- Pneumatic controllers: 33% of production segment methane — the largest single equipment category
- Equipment leaks: 9% of production segment methane
- Storage tanks: 8% of production segment methane
An OGI camera deployed at a compressor station covers all three simultaneously.

Pipeline and Flowline Connections
Flanges, valves, and fittings along gathering lines are high-frequency leak locations in LDAR programs. Aerial IR surveys — drone or fixed-wing — are increasingly used for midstream pipeline monitoring. Ground-based fixed cameras handle gathering line tie-ins at the wellsite perimeter. Each method covers terrain the other cannot reach effectively.
Natural Gas Processing and Separation Equipment
Separators, dehydration units, and gas-liquid interfaces generate emissions during both normal operation and upset conditions. OGI cameras allow operators to distinguish intentional process venting from abnormal fugitive releases — a distinction that directly affects emissions inventory accuracy and regulatory defensibility. Well Checked's Zensory.ai™ platform makes this distinction automatically: the AI Site Learning cycle establishes what "normal" looks like for each specific site, then focuses alerts on deviations from that baseline.
Periodic LDAR Inspections vs. Continuous IR Camera Monitoring
The Problem with Quarterly Snapshots
Traditional LDAR programs send certified inspectors to conduct OGI walkovers quarterly or annually. A leak that starts on day two of a 90-day cycle goes undetected for the rest of that quarter. The consequences compound quickly:
- Repair timelines stretch into months rather than hours
- Real emissions volume is chronically understated
- Without knowing how long a leak lasted, operators can't calculate actual gas volume lost — making repair ROI decisions essentially guesswork
EPA rules underscore the urgency, but repair deadlines vary by component, site type, and detection method. Earlier detection gives operators more time to investigate and act within the specific deadlines that apply to their equipment and approved monitoring plan.
The Case for Continuous Monitoring
Fixed IR cameras operating 24/7 detect emissions as they occur, enabling an acknowledge-dispatch-mitigate cycle measured in hours rather than weeks. As one Director of Operations who deployed continuous monitoring summarized:
"If all our sites are continuously monitored, when a Fugitive Gas Event occurs, which it will, we are proactively alerted and our team can acknowledge, dispatch, then mitigate within 24 hours. Rapid response to a timely methane survey event can support timely follow-up and documentation."
That's a 24-hour response window versus up to 90 days of undetected emissions — a gap that determines whether a leak becomes a line item or a regulatory event.

Well Checked's Zensory.ai™ Platform
The core challenge with fixed-camera deployments is alert fatigue. When every wind gust, condensation event, or routine process emission triggers an alarm, operators stop responding. Zentinal Core™ solves this through a ~2-day AI Site Learning cycle that establishes a site-specific normal baseline, then focuses alerts on system-validated fugitive anomalies — filtering out process noise, routine venting, and environmental interference.
At production scale, the Zensory.ai™ platform delivers:
- A confirmed multi-site program across the Appalachian Basin
- 1,500+ videos analyzed per site per day via onsite edge computing
- Continuous operation independent of network connectivity — remote wellsites stay monitored even during communications outages
The three-tier architecture separates visual intelligence, detection, and reporting. Zentinal Ops™ delivers high-resolution video and acoustic anomaly intelligence; Zentinal Core™ confirms the event; Zentinal IQ™ then quantifies it with documented volume, duration, and rate data designed to support applicable EPA and ESG reporting workflows, subject to operator review and required approvals.
How Infrared Camera Data Supports EPA Methane Rule Compliance
What OOOOb Requires
Under 40 CFR Part 60 Subpart OOOOb, upstream operators face specific monitoring obligations:
Monitoring frequency:
- Well sites and centralized production facilities: Quarterly OGI or EPA Method 21, plus bimonthly audio, visual, olfactory (AVO) inspections
- Compressor stations: Quarterly OGI or EPA Method 21, plus monthly AVO inspections
Repair deadlines:
- Deadlines vary by component, site type, and detection method
- Operators should apply the specific deadlines in the applicable rule and approved monitoring plan

Appendix K of Part 60 establishes work-practice and camera-performance requirements for OGI surveys, including prescribed sensitivity checks and observation procedures. It does not by itself approve every fixed or continuous OGI system as an alternative method.
Detection vs. Quantification
Detection triggers the repair obligation. But demonstrating compliance, calculating emission reduction credits, and satisfying OGMP 2.0's Gold Standard requirements (which demand source-level Level 4 and site-level Level 5 reporting) requires quantified data: volume, duration, and emission rate.
OGMP 2.0 membership reached 140 companies by 2024, covering roughly 42% of global oil and gas production. Every undetected leak also represents unrecovered product value and accumulating regulatory exposure. That financial exposure is exactly why detection alone isn't enough: investors and regulators both want the numbers behind the event.
Well Checked's Zentinal IQ™ layer generates this quantification data on top of confirmed Core detection events, structured for EPA Subpart OOOOb, OGMP 2.0 Level 4/5, SASB reporting frameworks. Critically, IQ only quantifies events after Core has validated them — keeping false-positive quantification out of the compliance record by design.
Documentation for Audits
Regulators look for:
- Timestamped event records
- Quantified emissions logs (volume, duration, rate)
- Calibration and commissioning records
- Repair verification documentation
- Multi-year data retention for audit response
Zentinal IQ™ produces operator-configured reporting logs, high-resolution event reconstruction packages, and trend analysis reports structured to support operator preparation of applicable EPA and state-agency submissions; final review and submission remain the operator's responsibility — plus CSV/JSON exports and SCADA API integration for operators who need data flowing into existing infrastructure.
Frequently Asked Questions
Can a thermal camera detect a water leak?
Yes — standard thermal cameras detect water leaks by identifying surface temperature anomalies caused by evaporative cooling or thermal mass differences. In oil and gas operations, the relevant tool is an OGI camera spectrally tuned for methane and VOC detection — liquid water and hydrocarbon gases demand entirely different spectral approaches.
What gases can infrared OGI cameras detect in oil and gas operations?
MWIR OGI cameras typically detect methane, ethane, propane, butane, pentane, benzene, toluene, and other VOCs. LWIR cameras cover gases with stronger long-wave absorption features, including CO₂, SF₆, and select VOCs. Verify your target gas list against the camera's published spectral response before deployment.
What is the difference between MWIR and LWIR infrared cameras for gas leak detection?
MWIR cameras (3–5 µm) use cooled detectors for high sensitivity and proven regulatory acceptance, particularly for methane — but cost approximately 3× more than LWIR alternatives. LWIR cameras (8–14 µm) use uncooled detectors at lower cost, with trade-offs in sensitivity and gas species coverage depending on application requirements.
How do infrared cameras support compliance with EPA methane regulations?
OGI cameras can be used for EPA work-practice surveys when the applicable camera-performance, observation, recordkeeping, and inspection-frequency requirements are met. Use of a fixed or continuous system as an alternative method requires separate EPA approval; quantified event data may support operator reporting workflows but does not itself establish compliance.
What is Optical Gas Imaging (OGI) and how is it used in oil and gas LDAR programs?
OGI uses spectrally filtered infrared imaging to render invisible gas plumes as visible smoke-like imagery in real time. In LDAR programs, it provides a faster, safer, non-contact alternative to contact-probe or soap-bubble methods, allowing technicians to scan large equipment assemblies from safe standoff distances.
Can infrared cameras for leak detection work at night or in adverse weather?
Fixed-mount IR cameras operate continuously day and night since they detect infrared radiation rather than visible light. High wind speeds, heavy rain, and uniform background temperatures reduce plume contrast and detection sensitivity. Camera placement and environmental compensation are therefore critical design decisions for any fixed-mount deployment.