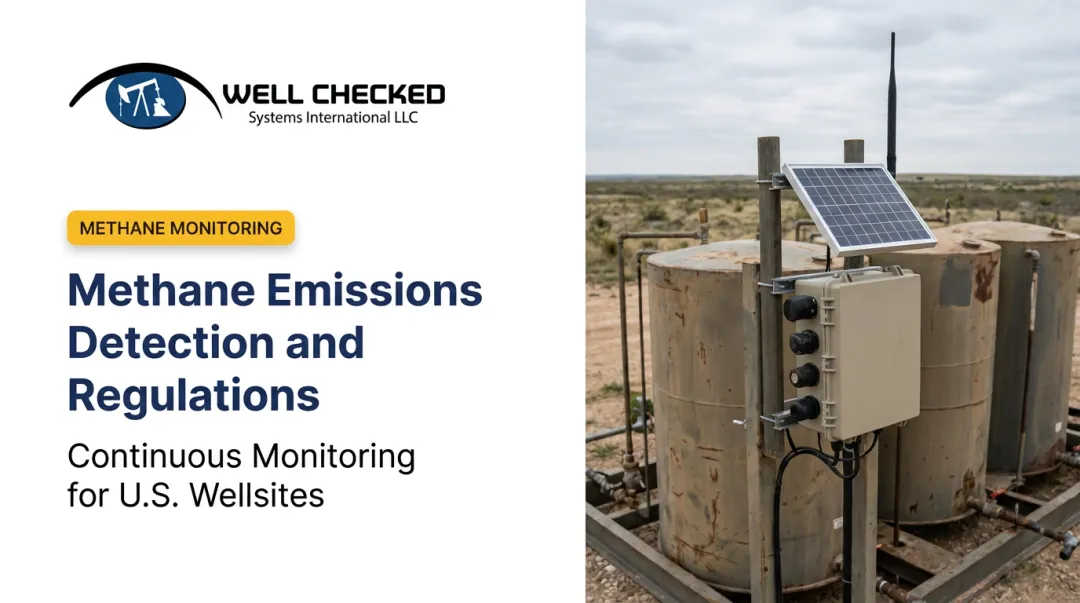
This guide walks through the tools you need, the three leading monitoring methods, how to read your results correctly, and the mistakes that get operators fined.
Key Takeaways
- Combine bottom-up (component-level) and top-down (aerial) data for complete coverage
- Continuous sensor monitoring catches episodic leaks that quarterly leak detection and repair (LDAR) routes routinely miss
- Reading ppm and %LEL correctly determines: no action or immediate mitigation
- Wrong placement, ignored wind data, and skipped calibration invalidate compliance results
- EPA's OOOOb rule, OGMP 2.0, and SASB/TCFD now demand measurement-based reporting
What You Need to Monitor Methane Emissions
A monitoring program is only as good as the combination of equipment and environmental conditions behind it. The right tools produce defensible data. The wrong setup, or the right tools deployed without accounting for wind, access, or calibration, produce numbers nobody can trust in an audit.
Tools and Indicators Required
Most upstream programs draw from some mix of these categories:
- Handheld gas analyzers and flame ionization detectors (FIDs) for component-level Method 21 screening
- Optical Gas Imaging (OGI) cameras, either mid-wave infrared (MWIR) or long-wave infrared (LWIR), for visualizing invisible plumes
- Acoustic leak detectors that pick up the ultrasonic signature of pressurized gas escaping a fitting
- Flux chambers for localized, intrusive flux measurement
- Drone or aircraft-mounted sensors for facility- and regional-scale screening
- Satellite remote sensing for wide-area, repeat surveillance

Operators track a handful of core indicators across these tools: methane concentration in ppm or %LEL, plume presence via infrared imaging, abnormal acoustic signatures, and wind speed/direction for any dispersion-based estimate. Well Checked has a USPTO provisional patent filing covering its acoustic anomaly detection technology.
Preconditions and Setup
Environmental conditions shape accuracy more than most operators expect: wind affects tracer and dispersion methods, while cloud cover and daylight affect optical and satellite readings. Site access and safety clearance determine whether a walkover survey can even happen on schedule.
Two setup steps matter regardless of method:
- Calibration: Zero and span checks on handheld instruments aren't optional; skipped calibration is one of the most common sources of bad data.
- Baseline establishment — Fixed sensor systems need a learning period to separate normal process emissions from true fugitive leaks. Well Checked's Zensory.ai™ platform, for example, runs a two-day AI site-learning cycle before alerting on anomalies.
Methods to Monitor Methane Emissions
Method selection comes down to three questions: what accuracy do you need, what's your budget, and are you screening for leaks or quantifying volume for compliance and ROI? Below are the three approaches most upstream operators choose from, often in combination.
Method 1: Handheld and Walkover Surveys (LDAR-Style)
This is the traditional approach: an inspector walks a route with a portable OGI camera or gas analyzer and screens each component.
Tools needed: Handheld OGI camera, toxic vapor analyzer (TVA), calibration gas.
- Establish a walking route and confirm safe access to each component
- Scan each area with the OGI camera or analyzer, noting any visual plume or elevated reading
- Log location, concentration, and time so follow-up repair can be scheduled
Pros: Low upfront cost, widely accepted by regulators. Cons: It's a snapshot. A peer-reviewed study of 46 oil and gas production sites found that most intermittent emissions went undetected during simulated periodic inspections, regardless of how often the surveys ran. Results also depend heavily on inspector skill and camera conditions.
Method 2: Continuous Fixed-Sensor and AI-Based Monitoring
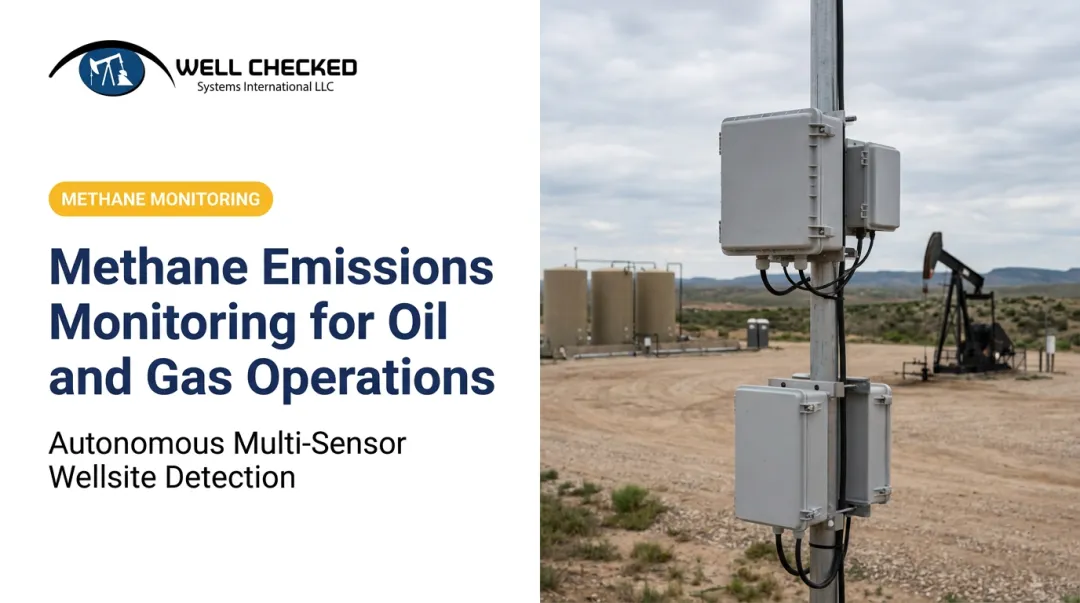
Instead of periodic visits, permanently installed multi-sensor units watch the site around the clock and use AI to separate normal operations from genuine anomalies.
Tools needed: Fixed IR/optical gas imaging cameras, acoustic equipment sensors, edge-computing analytics unit.
- Install multi-sensor units covering key equipment and the site perimeter
- Run an AI site-learning period to establish the site's normal baseline
- Receive alerts only on validated anomalies, triggering an acknowledge-dispatch-mitigate response
This is the model behind Well Checked's Zentinal Core™, which fuses video, LWIR optical gas imaging, and acoustic abnormal-sound detection into a single detection layer. Well Checked has a USPTO provisional patent filing for Detecting and Quantifying Fugitive Methane and Vapor Emissions Using Infrared Imaging and Machine Learning.
At production scale across 220 Appalachian Basin sites, the platform processes more than 1,500 videos per site per day, roughly one analysis every minute. It filters out routine process venting so field teams only respond to confirmed events. That validated-event data then feeds Zentinal IQ™, which quantifies volume and duration for regulatory reporting.
Pros: Captures episodic leaks 24/7, reduces false alarms and site-visit costs. Cons: Higher upfront investment per site than a manual survey.
Method 3: Aerial and Satellite Remote Sensing
Drone, aircraft, or satellite-mounted spectrometers detect methane plumes across large or hard-to-access areas by reading absorption signatures against the ground.
Tools needed: Aircraft or drone-mounted IR spectrometer, satellite data feed, wind/meteorological data for plume modeling.
- Schedule a flyover or satellite pass during suitable weather
- Capture methane column concentration data and cross-reference it with wind data
- Apply dispersion modeling to estimate total emission rate and flag hotspots for ground follow-up
| Platform | Resolution / Detection Range | Key Limitation |
|---|---|---|
| Aerial survey (BC study) | ~1-2m resolution; 0.7-3.5 kg/h detection threshold | Meteorology and calibration affect sensitivity |
| Satellite (point-source imaging class) | 25m pixels; ~180-240 kg/h detection limits | Surface reflectance, terrain, and wind reduce accuracy |
| Satellite (broad-area public class) | 7.5 x 5.5 km; sources above ~8 t/h | Cloud cover and coarse pixels limit attribution |
Pros: Excellent for covering large or distributed areas in a single pass. Cons: Weather and cloud cover interfere with readings, and it often can't pinpoint the exact leak source, only the general vicinity.

How to Interpret the Results
Misreading a concentration number cuts both ways. Miss a real leak and you're looking at safety risk, environmental damage, and a possible fine. Over-react to normal venting and you've wasted a dispatch and a repair budget.
Background atmospheric methane runs around 1,850-1,900 ppb globally, a figure NOAA tracks continuously from marine surface stations. Field readings need to be judged against that baseline, not against zero.
| Reading Type | What It Looks Like | Action |
|---|---|---|
| Normal | At or near background levels, or a process-vent signature the system has learned as routine | Routine logging only |
| Minor | Slightly elevated, short-duration (e.g., pneumatic controller cycling) | Log and monitor trend |
| Out-of-spec | Sustained or high-concentration, approaching %LEL thresholds, or a validated plume/acoustic anomaly | Acknowledge-dispatch-mitigate, document for repair ROI and reporting |
One conversion every field team should know cold:
1% methane concentration = 10,000 ppm
That's the quick math for comparing a sensor readout to an LEL threshold or a regulatory limit without pulling out a calculator mid-inspection.
Common Errors, Safety, and Regulatory Best Practices
Even good equipment produces bad data when the fundamentals get skipped.
Common errors:
- Misplacing the sensor or camera relative to the actual emission point, producing false negatives
- Ignoring wind speed and direction on dispersion or tracer-based readings, which skews quantification
- Failing to recalibrate handheld instruments, which produces missed anomalies or inaccurate readings
- Skipping the AI site-learning baseline, which triggers false alarms during normal process shifts
Safety and compliance practices worth building into every program:
- Follow lockout/isolation and PPE protocols during walkover surveys near live equipment
- Structure monitoring data for EPA's methane rule (40 CFR Part 60 Subpart OOOOb), OGMP 2.0 Level 4/5, and SASB/TCFD disclosure so it holds up during an audit
- Keep continuous records rather than periodic-snapshot logs, since regulators and investors are shifting toward measurement-based reporting standards
In practice, Well Checked structures Zentinal Core™ as the detection and event-record layer, while Zentinal IQ™ quantification outputs serve as evidentiary support for alternative-monitoring submissions under OOOOb. The same IQ outputs are formatted for OGMP 2.0 and SASB/TCFD reporting.
Conclusion
Accurate methane monitoring comes down to matching the right method to the job: handheld surveys for spot screening, continuous sensors for round-the-clock coverage, remote sensing for regional context. Few operators need just one.
Get that match right and the payoff is straightforward: fewer missed leaks, lower compliance risk, and better data for repair-and-maintenance ROI decisions. As EPA rules and ESG disclosure requirements tighten, operators are shifting to continuous, multi-sensor monitoring. Platforms like Zensory.ai™ build this in with an acknowledge-dispatch-mitigate workflow, positioning operators to work by exception instead of by routine site visit.
Frequently Asked Questions
How do you measure methane emissions?
Methane is measured using handheld gas analyzers or OGI cameras for spot checks, fixed continuous sensors for ongoing site monitoring, or aerial and satellite remote sensing for large-area detection. Concentration is typically reported in ppm or %LEL.
What are the top 3 sources of methane emissions?
Fossil fuels (oil, gas, and coal), agriculture (livestock and manure), and the waste sector (landfills and wastewater) are the three largest anthropogenic sources globally.
How many ppm is 1% methane?
One percent methane concentration equals 10,000 ppm. That conversion is essential for comparing field sensor readings against LEL and regulatory thresholds.
What is Optical Gas Imaging (OGI) and how does it detect methane?
OGI cameras use infrared wavelengths to visualize methane and volatile organic compound (VOC) plumes that are invisible to the naked eye. This lets inspectors, or fixed continuous systems, spot leaks in real time against a thermal background.
What is the difference between top-down and bottom-up methane monitoring?
Bottom-up methods measure emissions at the source or component level. Top-down methods use atmospheric, aerial, or satellite data to estimate total emissions across a wider area. Combining both gives the most complete picture.
How often are oil & gas operators required to monitor methane emissions for EPA compliance?
Requirements vary by rule and site type. EPA's methane rule (40 CFR Part 60 Subpart OOOOb) is pushing many operators toward more frequent, or continuous, monitoring in place of quarterly-only LDAR inspections. Platforms like Well Checked Systems' Zentinal Core™ support this shift by providing continuous, autonomous detection between required inspections, while Zentinal IQ™ produces the quantification outputs structured for OOOOb alternative-monitoring submissions.