Heading into 2026, upstream operators face a compliance stack that no longer tolerates estimate-based reporting: EPA's methane rule under 40 CFR Part 60 Subpart OOOOb, state agency inventory mandates, OGMP 2.0's push toward measurement-based disclosure, and SASB/TCFD frameworks for publicly traded E&Ps. These pressures are converging at once, and periodic inspections can't keep pace.
Continuous, AI-driven monitoring is becoming the new baseline. This guide covers the regulatory landscape shaping 2026, the core technologies driving detection, best practices for building a defensible program, and how to evaluate a monitoring partner.
Key Takeaways
- Continuous, multi-sensor monitoring is replacing quarterly LDAR surveys as the compliance standard.
- EPA OOOOb and OGMP 2.0 Level 4/5 require measurement-based quantification—not estimates.
- False-alarm filtering and 24-hour acknowledge-dispatch-mitigate workflows are now regulatory necessities.
- Fusing video, infrared, and acoustic detection in one platform lowers compliance risk and monitoring opex.
The 2026 Regulatory Landscape for Emissions Compliance
EPA's OOOOb Rule and Alternative Monitoring
Subpart OOOOb applies to crude oil and natural gas facilities constructed, modified, or reconstructed after December 6, 2022. Continuous monitoring means determining a valid methane mass-emissions rate at least once per 12-hour block. Periodic screening is allowed as an alternative, ranging from quarterly AVO checks to semiannual OGI surveys depending on source type. Operators that want an alternative technology instead of the prescribed methods must submit a Methane Alternative Test Method request under 40 CFR 60.5398b(d). Vendor capability alone is not approval — EPA evaluates the method itself. Repair timelines for compliance defensibility:
- 15 calendar days for AVO-identified fugitive emissions
- 30 days for OGI or Method 21 detections
State Variation Is Real
Federal rules set the floor. State programs often go further, so multi-basin operators cannot treat compliance as one-size-fits-all:
- Colorado — Regulation 7 phases out gas-driven pneumatic controllers statewide by 2029 and tightened LDAR for processing plants in February 2026
- Pennsylvania — DEP announced in July 2026 that it is developing statewide rules requiring LDAR and phasing out routine venting and flaring
- New Mexico — continues building its own methane framework under executive order Because thresholds shift by state and by year, verify current requirements directly with EPA and your state agency rather than relying on any static published figure.
Where OGMP 2.0, SASB, and TCFD Fit
Regulatory LDAR is only part of the picture. Investor and voluntary frameworks now demand the same underlying measured data. OGMP 2.0 Level 4 covers source-level emissions inventories; Level 5 reconciles that inventory against independent, site-level measurements. For publicly traded E&Ps, SASB's EM-EP-110a.1 metric requires disclosure of gross Scope 1 emissions and the percentage that is methane. TCFD's metrics-and-targets pillar asks for the same emissions data. The task force disbanded in 2023, but its recommendations remain the disclosure template most investors expect. All four frameworks want measured data, not engineering estimates.
Core Technologies Powering Modern Emissions Monitoring
CEMS vs. PEMS
Two monitoring architectures dominate industrial emissions programs:
- CEMS (Continuous Emission Monitoring Systems): direct pollutant-analyzer measurements of concentration or emission rate
- PEMS (Predictive Emission Monitoring Systems): modeled emissions from process parameters
For upstream methane, a process model alone does not satisfy OOOOb. The system still must meet the rule's valid-mass-rate requirement through an approved pathway.
Optical Gas Imaging: LWIR vs. MWIR
Where CEMS/PEMS track stack or process rates, optical gas imaging (OGI) makes fugitive plumes visible. Camera waveband drives both cost and sensitivity:
| Spec | Cooled MWIR | Uncooled LWIR |
|---|---|---|
| Wavelength | 3–5 μm | 7–14 μm |
| Camera cost (before support gear) | ~$50,000 | 67% to 80% less |
| Sensitivity | Higher | Comparable only if coupled with advanced AI |

Site design matters as much as camera choice. LWIR still enables day/night methane and VOC detection at a fraction of legacy MWIR cost, which is why it is the practical entry point for multi-sensor platforms such as Well Checked's Zensory.ai™.
Acoustic Detection as a Complementary Layer
Sight-based systems miss what sound catches. Acoustic anomaly detection listens for leak-generated sound signatures on equipment such as compressors, catching micro-leaks in high-pressure lines that OGI cameras cannot always resolve.
Environmental noise can still trigger false alarms. Multisensor fusion with machine learning is now the standard way to keep those alerts trustworthy.
AI Site-Learning Cuts False Alarms
A camera that flags every flare stack flicker is useless. Modern platforms run an AI site-learning period, typically around two days per site, to build a normal operational baseline before separating routine process emissions from true fugitive events.
Well Checked's Zentinal Core™ uses this approach and re-learns automatically whenever site configuration changes.
Edge Computing for Remote Wellsites
Connectivity at a remote pad can be spotty at best. Edge computing processes video, infrared, and acoustic data onsite, stores results locally, and syncs when the link returns. Detection does not depend on a live network connection.

Market context: The global Emission Monitoring System market (CEMS/PEMS across all industries, not upstream methane alone) is projected to grow from $4.76 billion in 2026 to $8.53 billion by 2033, an 8.7% CAGR. That trajectory reflects broad adoption momentum behind continuous monitoring stacks.
Best Practices for Building a Defensible Compliance Program
A defensible program is built on source design, risk-matched monitoring, and continuous records—not on end-of-quarter snapshots. Use these five practices to stay audit-ready under EPA Subpart OOOOb.
Characterize sources first. Categorize point sources, fugitive area sources, and intermittent process releases before picking a monitoring approach. OOOOb monitoring plans must document site coordinates, methods, spatial resolution, and monitoring frequency.
Match technology to risk. Use continuous monitoring for major sources and less frequent verification for minor ones. Don't apply a single cadence across every asset class.
Build QA protocols that hold up. Calibration schedules, data validation, and documentation should satisfy both regulatory review and third-party verification. Appendix K requires a QA verification video for each OGI operator at least once per monitoring day.
Implement acknowledge-dispatch-mitigate workflows. Define response windows (a 24-hour turnaround is becoming the practical standard) to limit fine exposure on validated events.
Keep continuous records, not snapshots. Duration and volume data support repair ROI decisions in a way quarterly LDAR reports cannot.

Why Continuous, Multi-Sensor Monitoring Outperforms Traditional LDAR
Quarterly LDAR surveys leave detection gaps measured in weeks. A 2019 Stanford-led field comparison found periodic inspection methods detected leaks below 1 scfh less than 30% of the time. Continuous systems close that gap and reduce the safety exposure of routine site travel.
Operate by Exception
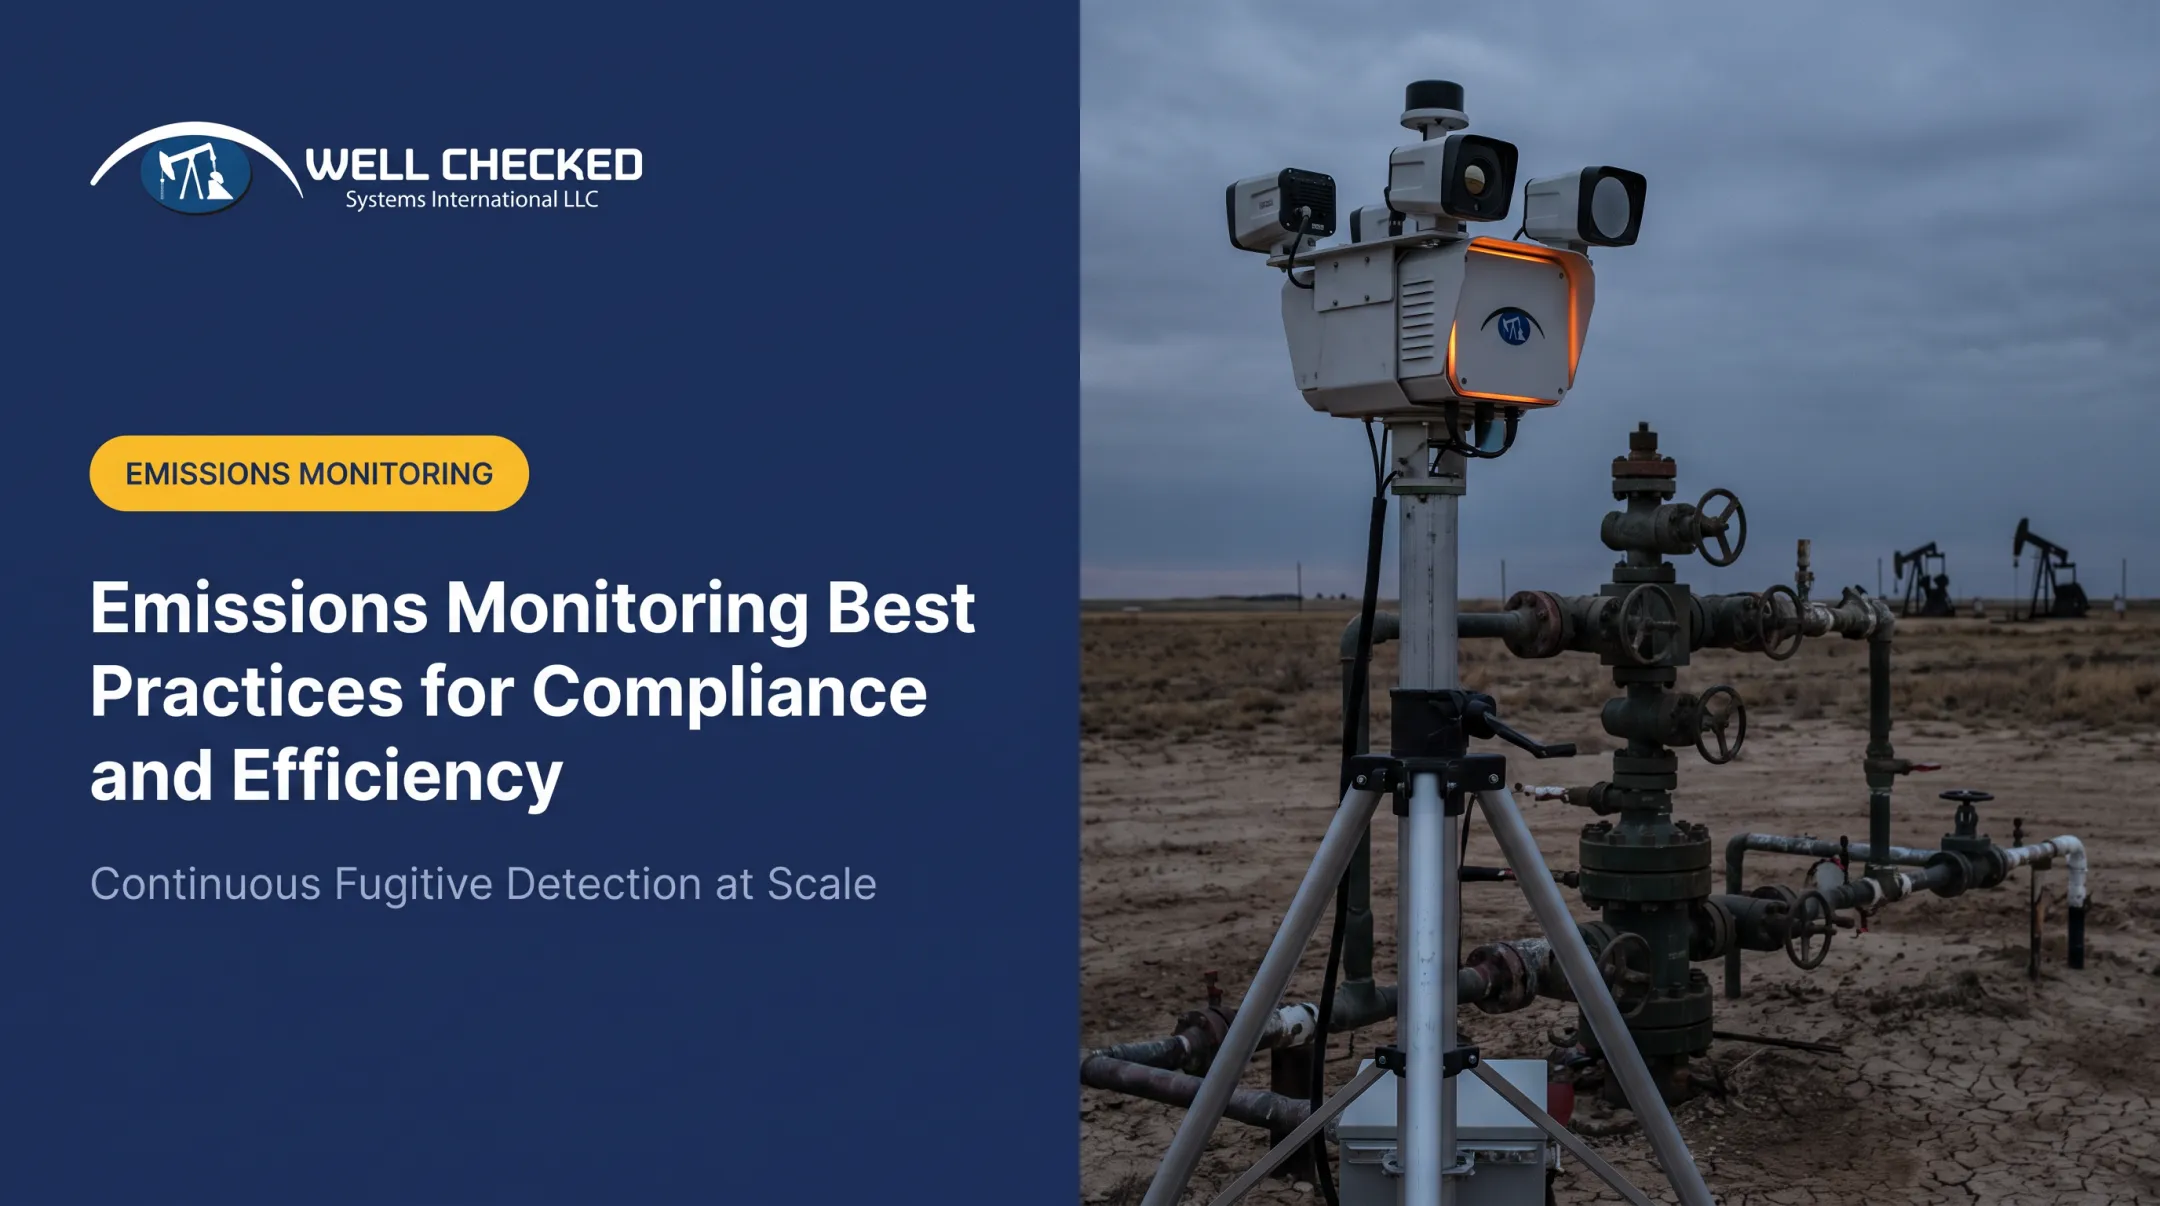
Reviewing every video frame or sensor stream manually isn't sustainable. The "operate by exception" model flips this: multi-sensor detection cross-checks video, LWIR, and acoustic inputs, so operators review only validated anomalies—not raw feeds. That's the architecture behind Well Checked's Zensory.ai™ platform:
- Zentinal Ops™ — visual and acoustic site intelligence
- Zentinal Core™ — multi-sensor detection with false-alarm filtering across video, LWIR, and acoustic inputs
- Zentinal IQ™ — regulatory-defensible quantification, run only after Core validates an event
This architecture runs across remote U.S. onshore sites, including a continuous monitoring deployment in the Appalachian Basin.

The Cost Case
Mid-sized to large operators spend an estimated $1 million to $5 million or more annually on route-based site visits. Continuous, multi-sensor monitoring offsets that spend by replacing routine travel with autonomous detection:
- Cuts unproductive operator-route vehicle miles
- Reduces the emissions those site visits produce
- Frees field teams for exception response instead of calendar-driven checks
Choosing an Emissions Monitoring Technology Partner
Not every sensor vendor can deliver regulatory-defensible data. When you evaluate partners, prioritize:
- Framework alignment — platforms structured for EPA Subpart OOOOb, OGMP 2.0, SASB, and TCFD, not just raw sensor feeds
- Proven false-alarm filtering at scale — ask for a documented multi-site track record and the daily data volume processed
- Connectivity independence — confirm the system operates via onsite edge computing, not a live network dependency
- A phased adoption path — start with detection-only capability and add regulatory-grade quantification as reporting demands grow (for example, Zentinal Ops™/Core™ into Zentinal IQ™)
Vendor claims should be checked against documented EPA alternative-method approval status, not marketing language alone.
Frequently Asked Questions
What is a CEMS system?
A Continuous Emission Monitoring System uses pollutant-analyzer measurements to continuously determine and report concentration or emission rates from industrial sources.
What is the difference between CEMS and PEMS?
CEMS relies on direct, continuous sensor measurement of pollutant concentration. PEMS predicts emissions using process-parameter data and a modeled equation instead of direct sensing.
How often do oil and gas operators need to monitor for methane emissions under the EPA's 2026 rules?
Subpart OOOOb favors continuous or high-frequency monitoring over quarterly-only surveys, though periodic options remain for some source types. Verify current frequency requirements directly with EPA, since thresholds vary by source category.
What is OGMP 2.0 Level 5 reporting?
Level 5 requires site-level, measurement-based emissions data that's reconciled against source-level engineering estimates, rather than relying on estimates alone.
Can AI reduce false alarms in emissions monitoring?
Yes. AI site-learning models establish a site-specific operational baseline, then flag deviations from that baseline as true anomalies, filtering out normal process emissions that would otherwise trigger unnecessary alerts.
How much does continuous emissions monitoring cost compared to traditional LDAR inspections?
Continuous monitoring is designed to offset the $1M–$5M+ annual cost that mid-to-large operators spend on route-based site visits, though upfront investment varies by deployment scale and site count.