Introduction
A pressure gauge creeps past its safe range on a Tuesday. Nobody notices until the quarterly inspection three months later. By then, the leak has cost thousands in lost product, a compliance violation, or worse, an unplanned shutdown.
This is the reality for teams still relying on manual checks, route-based inspections, or dashboard-watching. Problems hide in the gap between visits.
An automated monitoring system continuously collects and analyzes data to detect deviations and trigger alerts, without waiting for someone to walk the site or open a spreadsheet. This guide covers what these systems are, the main types in use today, real benefits, typical costs, and how to pick the right one.
Across oil and gas operations, the term spans wellsite monitoring, pipeline networks, compressor stations, and emissions compliance programs. Different sensors, same principle: continuous, technology-driven oversight supplements periodic manual snapshots.
Key Takeaways
- Continuous monitoring cuts detection time from weeks to minutes versus manual checks
- Five monitoring categories exist: industrial, IT, AI-model, environmental, and security
- SaaS tools cost a few thousand dollars monthly; industrial hardware runs into six figures
- EPA methane rules and OGMP 2.0 reporting push oil & gas operators toward purpose-built platforms
What Is an Automated Monitoring System?
An automated monitoring system is a technology stack that continuously observes, measures, and analyzes data streams to catch deviations before they become failures. Instead of a technician checking a gauge once a shift, sensors feed data into software around the clock. When something drifts outside normal parameters, the system flags it, often before a human would even think to look.
How Automated Monitoring Systems Work
The data flow follows a consistent pattern across industries:
- Sensors or collection devices capture raw signals (temperature, gas concentration, acoustic signatures, network traffic)
- Transmission infrastructure relays that data to a central or edge processing point
- Analytics software processes the stream and compares it against expected behavior
- Alerts and dashboards notify the right person or system the moment a deviation appears
- Control systems or human operators respond, either automatically or through a dispatched action

The detection logic underneath varies. Simpler systems use baseline-and-threshold rules, meaning anything outside a set threshold or statistical range triggers an alert. More sophisticated platforms train machine learning models on historical data, letting them learn what "normal" looks like for a specific asset or site, then flag genuine anomalies rather than routine fluctuation.
Core Components
The workflow above depends on five hardware and software building blocks working in concert:
- Sensors/data collection devices: the physical or software-based inputs gathering raw signals
- Data transmission infrastructure: networks, APIs, or wireless protocols moving data from source to processor
- Analytics/processing software: the engine that interprets data and identifies deviations
- Alerting and escalation logic: rules determining who gets notified, how, and when
- User dashboards/interfaces: the visual layer where teams review status and history
One trend reshaping this stack is edge computing. In remote or connectivity-limited environments, on-site processing lets a system keep detecting and alerting even when a network connection drops. Rather than sending every data point to the cloud for analysis, the intelligence lives on-site.
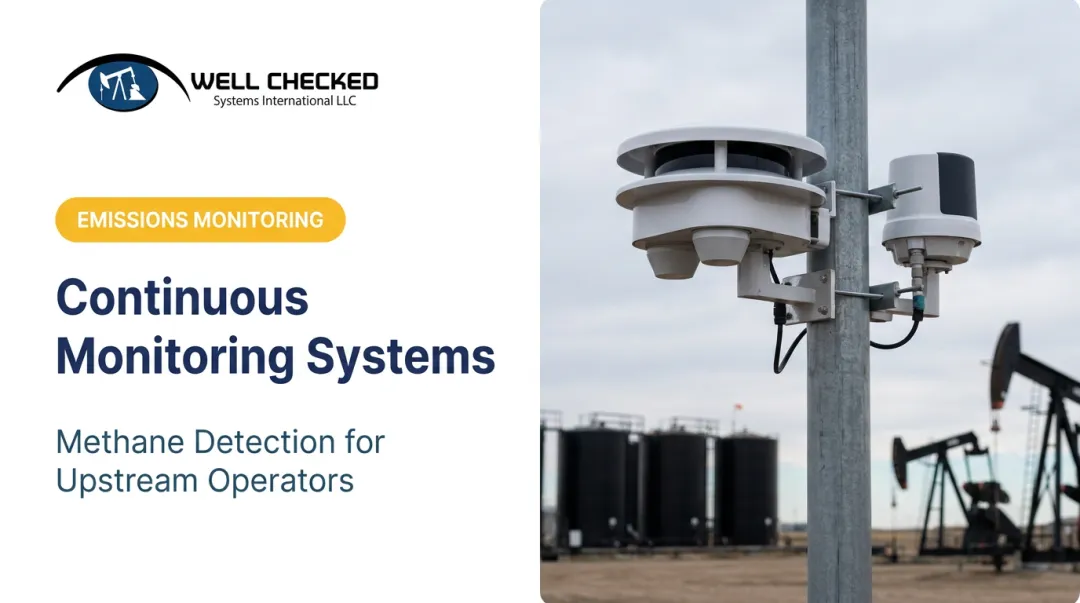
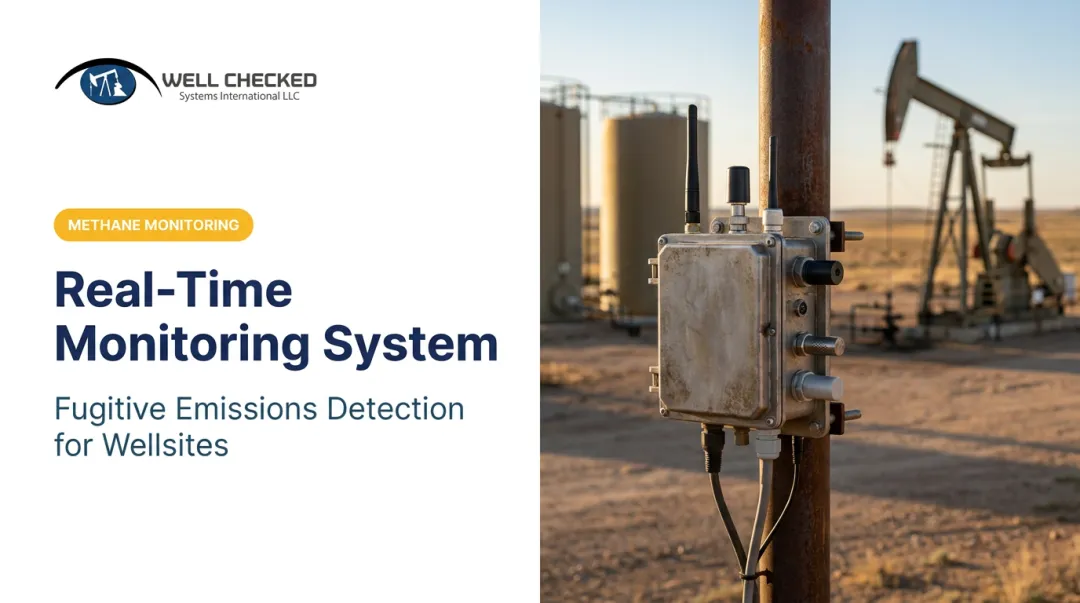
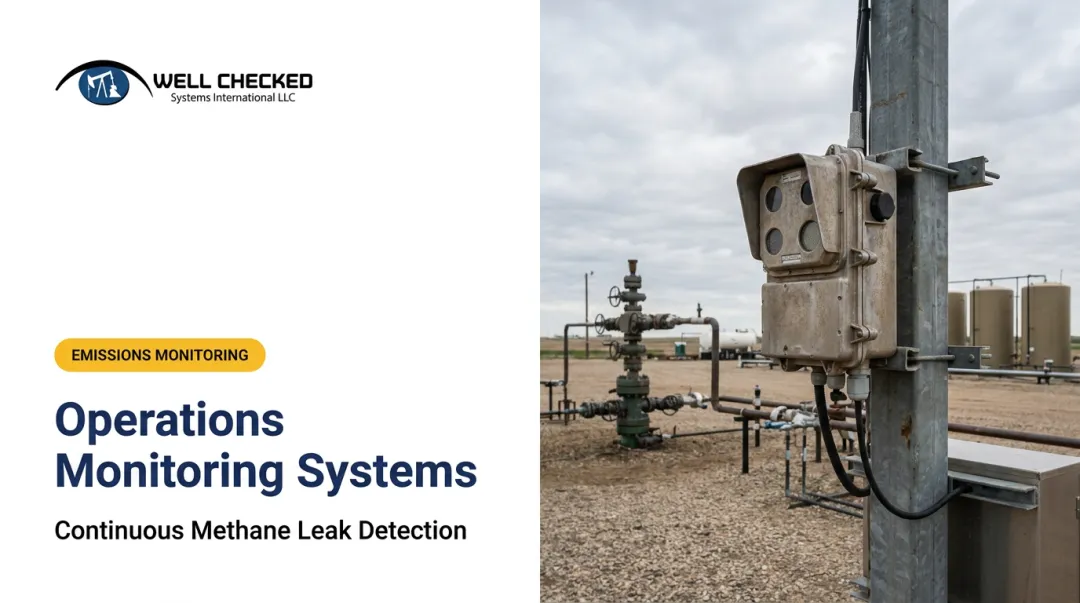
Well Checked Systems applies this approach at remote wellsites, where local processing keeps methane detection running even when cellular or satellite links drop, syncing results once connectivity returns.
Types of Automated Monitoring Systems (With Real-World Examples)
Automated monitoring spans several distinct approaches, each built to catch a different kind of signal.
Process/Industrial Monitoring Sensors track temperature, pressure, vibration, and flow on production lines, feeding predictive maintenance programs that catch equipment wear before it causes downtime.
Business/IT Activity Monitoring BI and analytics platforms automatically detect anomalies in KPIs, sales trends, fraud patterns, or API performance. Built-in anomaly detection in BI tools is a widely used example, flagging unexpected shifts in time-series charts without manual review.
AI Model Monitoring As organizations deploy machine learning models, they need systems tracking accuracy, data drift, model bias, and regulatory compliance, particularly in regulated sectors like financial services. AI observability platforms monitor predictive and generative models for drift, data quality issues, and hallucinations.
Environmental & Emissions Monitoring Continuous Emissions Monitoring Systems (CEMS) and Automated Measuring Systems (AMS) track air quality and industrial stack emissions using gas analyzers and optical sensors. In the U.S., EPA Performance Specifications under 40 CFR Part 60, Appendix B, set the quality assurance requirements for these systems, covering everything from initial certification testing to ongoing relative accuracy audits.
Security/Cybersecurity Monitoring These systems detect suspicious network activity or unauthorized access attempts in real time. Network analytics platforms use behavioral modeling to catch unknown malware and insider threats in real time, well before they'd otherwise surface in a breach report.
Quick reference — named examples across categories:
- SCADA systems
- BI anomaly detection tools
- CEMS stack analyzers
- AI observability platforms
- Wellsite methane-detection systems (Well Checked Systems' Zensory.ai™)
Key Benefits of Automated Monitoring Systems
Faster Detection, Faster Response
Continuous monitoring closes the gap between "something went wrong" and "someone found out." Automation Alley reports that continuous systems can alert personnel within minutes of a deviation, compared to manual inspections conducted once or twice per quarter, under which a problem may exist undetected for months.
Lower Costs, Fewer Surprises
The financial case is well documented. McKinsey's analysis of analytics-based maintenance strategies found:
- 18%-25% maintenance-cost reductions from advanced troubleshooting programs
- 30% lower labor and parts costs in one condition-based maintenance framework
- 10% false-positive rate in one implementation wiped out $1 million in projected annual gains

That last point matters. A system that cries wolf constantly isn't actually saving anyone money.
Consistency, Documentation, and Scale
Beyond speed and cost, automated monitoring delivers other measurable advantages traditional inspections can't match:
- Consistency: Automated systems apply identical detection criteria every time — no fatigue, no missed readings at hour ten of a shift.
- Documentation: Continuous record-keeping builds an audit trail that beats a quarterly inspection report when regulators ask for proof of compliance.
- Scale: Cloud, IoT, and edge-AI let one platform monitor hundreds of variables across multiple sites. Well Checked Systems runs this model across continuous monitoring in the Appalachian Basin.
Automated Monitoring in Oil & Gas: A Closer Look
Upstream operators face a distinct version of this challenge. Remote well sites are spread across basins, and route-based operator visits, where a technician physically drives to each site, commonly cost mid-sized to large operators $1M to $5M+ annually.
On top of that expense, EPA's Subpart OOOOb methane rule now requires inspection frequencies ranging from quarterly audible/visual/olfactory checks at small sites to monthly checks plus quarterly optical gas imaging at compressor stations. Add OGMP 2.0 and ESG reporting pressure, and manual route-based operations start looking outdated fast.
This is the exact gap Well Checked Systems built Zensory.ai™ to close. The platform combines three sensor types working together:
- Sight: high-resolution cameras with AI object detection, providing continuous site surveillance
- Gas imaging: Long-Wave Infrared (LWIR) Optical Gas Imaging cameras that detect methane and VOCs invisible to the naked eye, day or night
- Sound: acoustic anomaly AI that learns each site's normal equipment noise and flags abnormal signatures suggesting mechanical failure
A Three-Tier Architecture
The platform separates visual intelligence, detection, and reporting across three product tiers:
- Zentinal Ops™ provides visual and acoustic equipment intelligence: high-resolution video, object recognition, acoustic anomaly detection, and actionable alerts (the acoustic anomaly detection capability is backed by a Well Checked patent)
- Zentinal Core™ establishes a site-specific "normal" baseline in roughly 2 days per site, then filters out false alarms so operators only see genuine fugitive emission events, not every process fluctuation; supports OGMP 2.0 Level 3
- Zentinal IQ™ activates only after Core validates an event, applying LWIR volumetric analysis to quantify emission volume, duration, and rate for OGMP 2.0 Level 4/5, SASB, and TCFD-aligned reporting
This structure matters because it moves automated monitoring beyond simple alerting into something regulators can actually act on. When an event is confirmed, alerts route through the dashboard, email, SMS, and SCADA API simultaneously. This triggers an acknowledge-dispatch-mitigate workflow that aims to resolve validated events within 24 hours, a window specifically tied to supporting a documented, timely response.
Beyond the alerting workflow, the platform's scale becomes clear: it processes continuous video on-site through edge computing, meaning detection continues even when network connectivity drops at a remote pad. The largest confirmed proof point is a continuous monitoring across the Appalachian Basin, part of a broader footprint covering remote U.S. onshore sites.

How Much Does an Automated Monitoring System Cost?
Cost depends entirely on scope. Software-only business monitoring tools sit at the low end; industrial and environmental hardware deployments cost considerably more.
Approximate cost ranges by category:
| System Type | Typical Cost Range | Billing Model |
|---|---|---|
| BI/analytics anomaly detection | $14-$24 per user/month | Per-user SaaS |
| IT infrastructure monitoring | $7+ per host/month | Per-host SaaS |
| Industrial/environmental hardware | Capital-cost scale, quoted per deployment | Capital + installation + ongoing O&M |
What Drives the Price
- Number of monitored sites and variables: more sensors and locations mean more hardware and integration work
- Sensor sophistication: LWIR optical gas imaging cameras run at roughly one-third the cost of traditional mid-wave infrared alternatives
- Data connectivity requirements: remote sites with poor connectivity often need edge computing, adding cost but removing network dependency
- Regulatory-grade quantification: systems producing defensible compliance data, not just detection alerts, require additional processing and validation layers
Reframing Cost as ROI
Hardware and subscription costs matter less in isolation than in comparison to what they replace. For oil and gas operators, that comparison is stark: route-based operator programs run $1M-$5M+ annually, while a monitoring platform reduces required site visits, catches leaks faster, and supports a rapid, documented response record.
Well Checked Systems offers purchase, lease, and subscription models, along with a fixed-fee pilot program. This lets operators validate ROI on a defined site count before committing to a full rollout.
Choosing and Implementing the Right Automated Monitoring System
Balance Sensitivity Against Alert Fatigue
Alert fatigue, not a missed anomaly, is the top implementation risk. False alerts pile up until teams start ignoring the system entirely.
Look for platforms with a defined AI learning period, typically a few days, that establish a normal-behavior baseline before alerting begins. Zensory.ai™'s roughly 2-day-per-site learning cycle is one example of this approach applied at scale.
Check Integration and Scalability
Before committing to a platform, verify:
- Compatibility with existing SCADA, ERP, or dashboard infrastructure
- Ability to start small (single-site detection) and expand to multi-site regulatory reporting
- Data export options (CSV/JSON, API access) for feeding downstream ESG or compliance software
Plan for Change Management
Shifting from manual, routine checks to an "operate by exception" model requires training. Teams need to trust validated alerts enough to stop manually re-checking everything, while still knowing when a flagged event genuinely needs a field visit. This cultural shift, more than the technology itself, determines whether a rollout succeeds.
Frequently Asked Questions
How much does an automated monitoring system cost?
Costs range from per-user subscription pricing for SaaS-based monitoring tools to tens of thousands per site for industrial hardware deployments. ROI comes from labor savings, reduced downtime, and avoided compliance fines—not the sticker price alone.
What are the main types of monitoring used in automated monitoring systems?
The primary categories are process/industrial, business/IT analytics, AI-model, environmental/emissions, and security monitoring. Each combines sensors, data pipelines, and alert logic tailored to its specific signal type.
What are examples of automated monitoring systems?
Examples include industrial SCADA platforms, business-intelligence anomaly detection tools, stack-based CEMS analyzers, and wellsite methane-detection systems such as Well Checked Systems' Zensory.ai™.
How does an automated monitoring system detect anomalies?
Systems compare live data against a baseline: fixed thresholds, standard deviation bands, or a machine learning model trained on historical patterns. Anomalies outside that baseline trigger alerts for review or automated response.
What industries benefit most from automated monitoring systems?
Manufacturing, oil and gas, financial services, IT/software, and environmental compliance lead adoption. Each industry faces high costs from downtime, leaks, or regulatory violations that continuous monitoring directly addresses.
Can automated monitoring systems replace manual inspections entirely?
Not entirely. The "operate by exception" model lets automation handle routine oversight, but human review remains essential for validated events, edge cases, and physical repairs that no sensor can complete on its own.