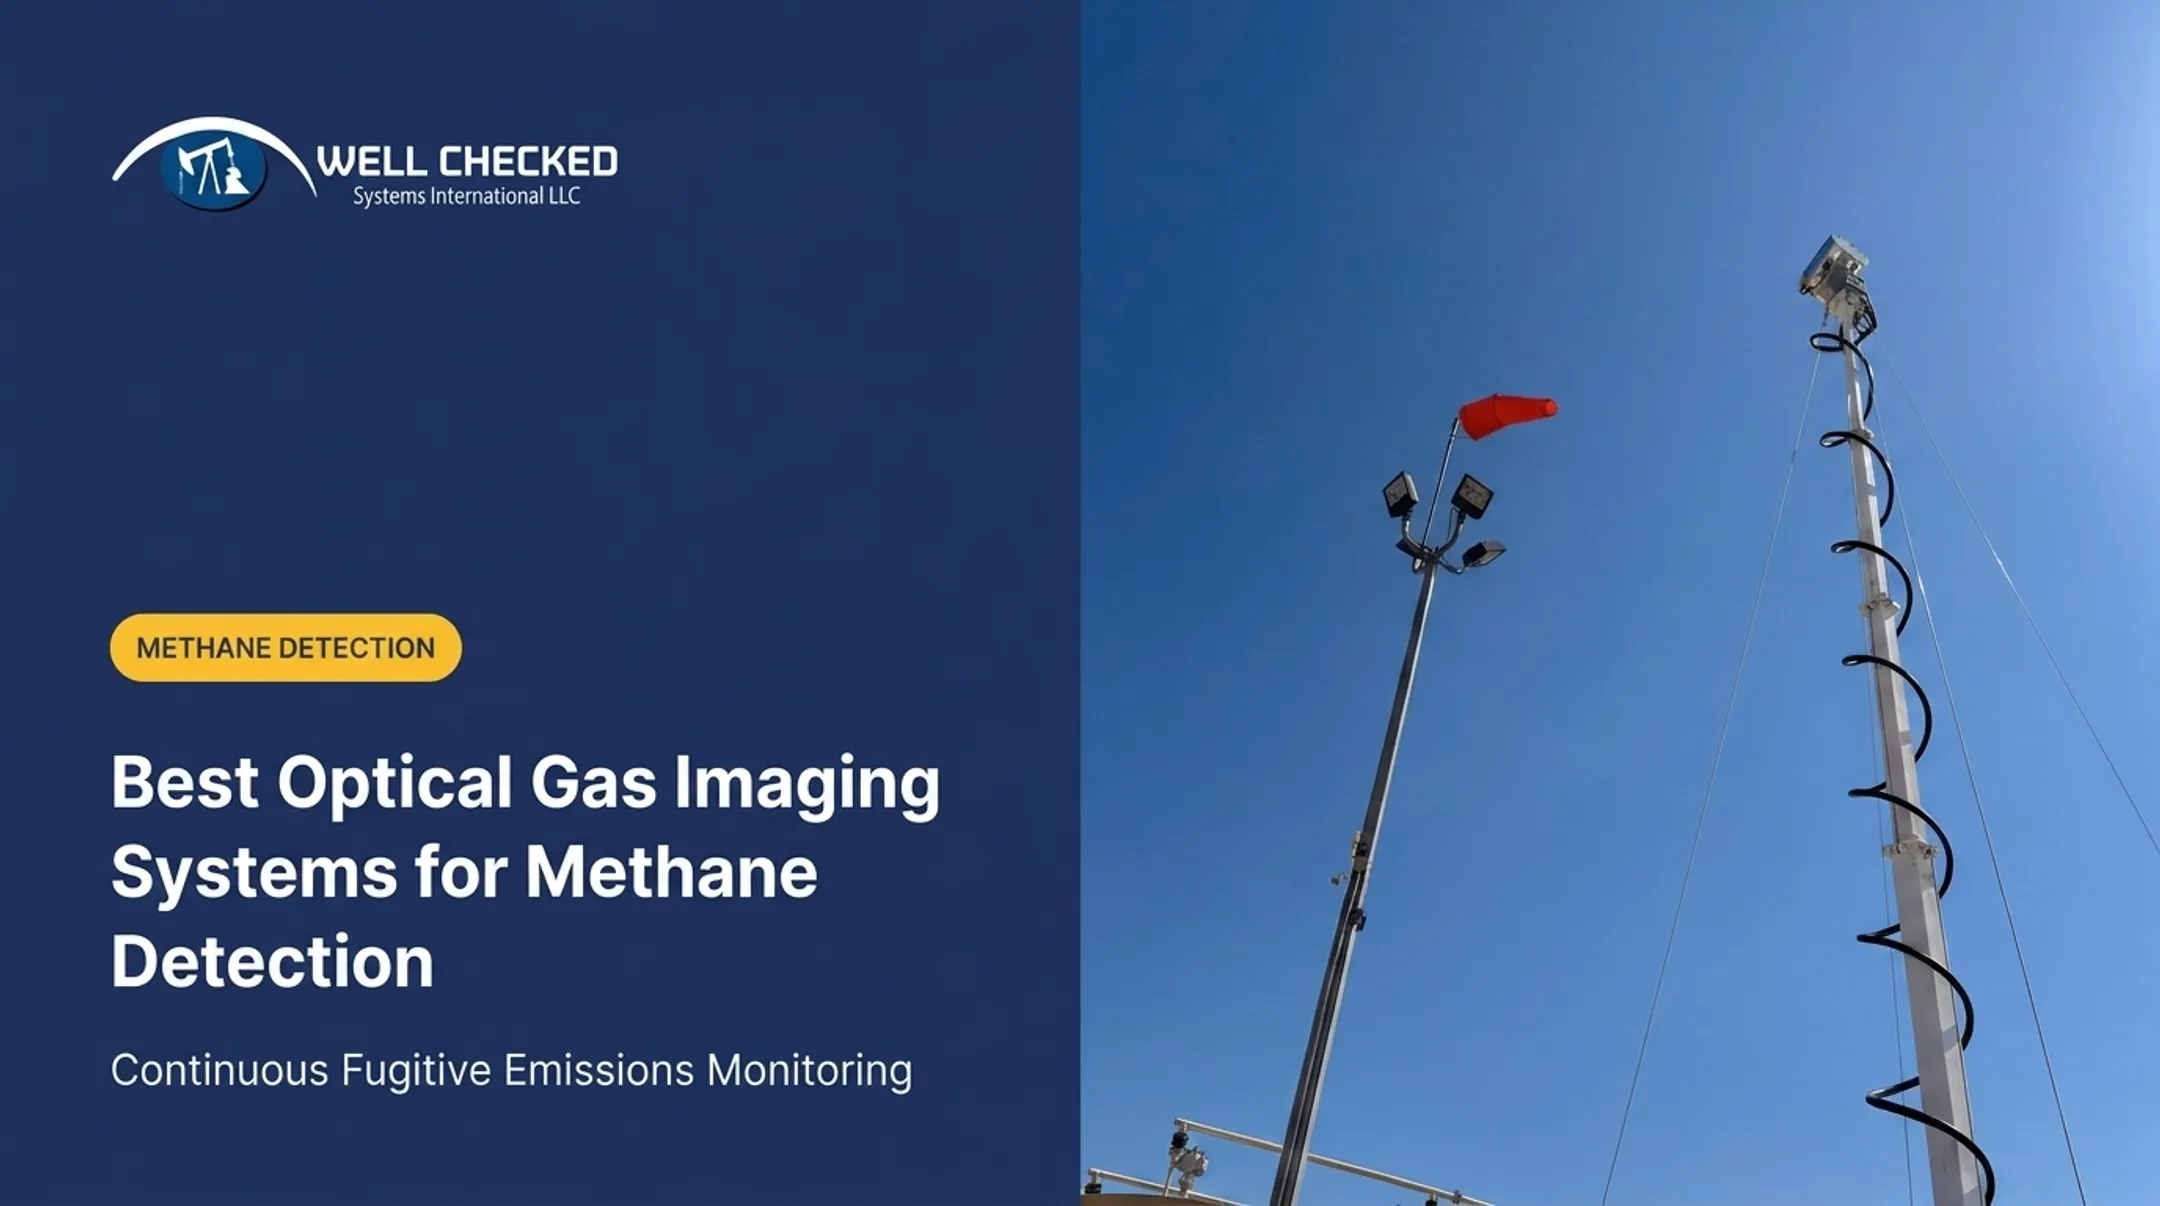
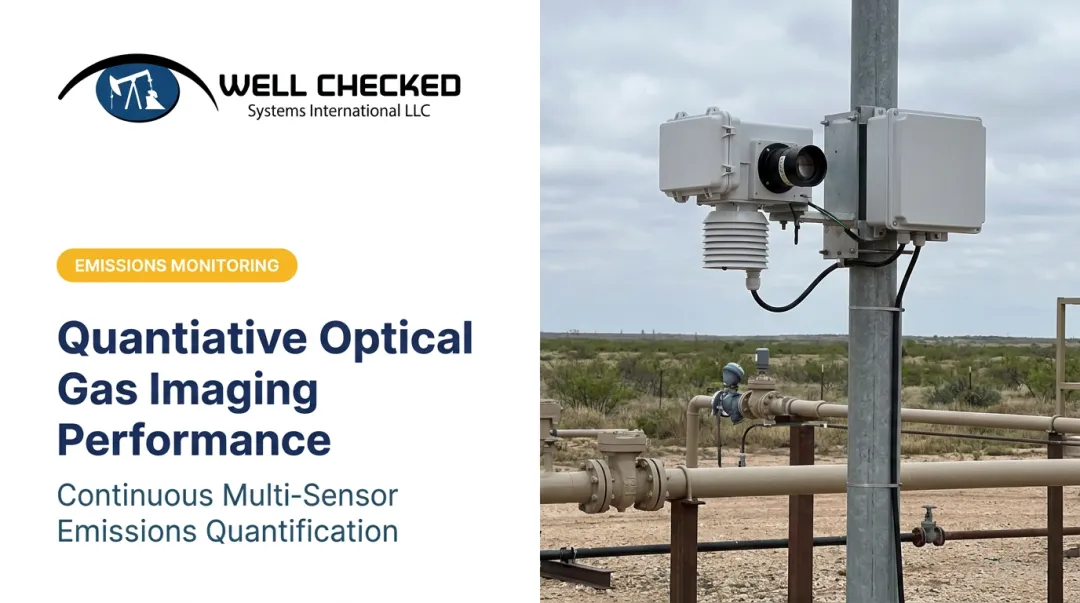
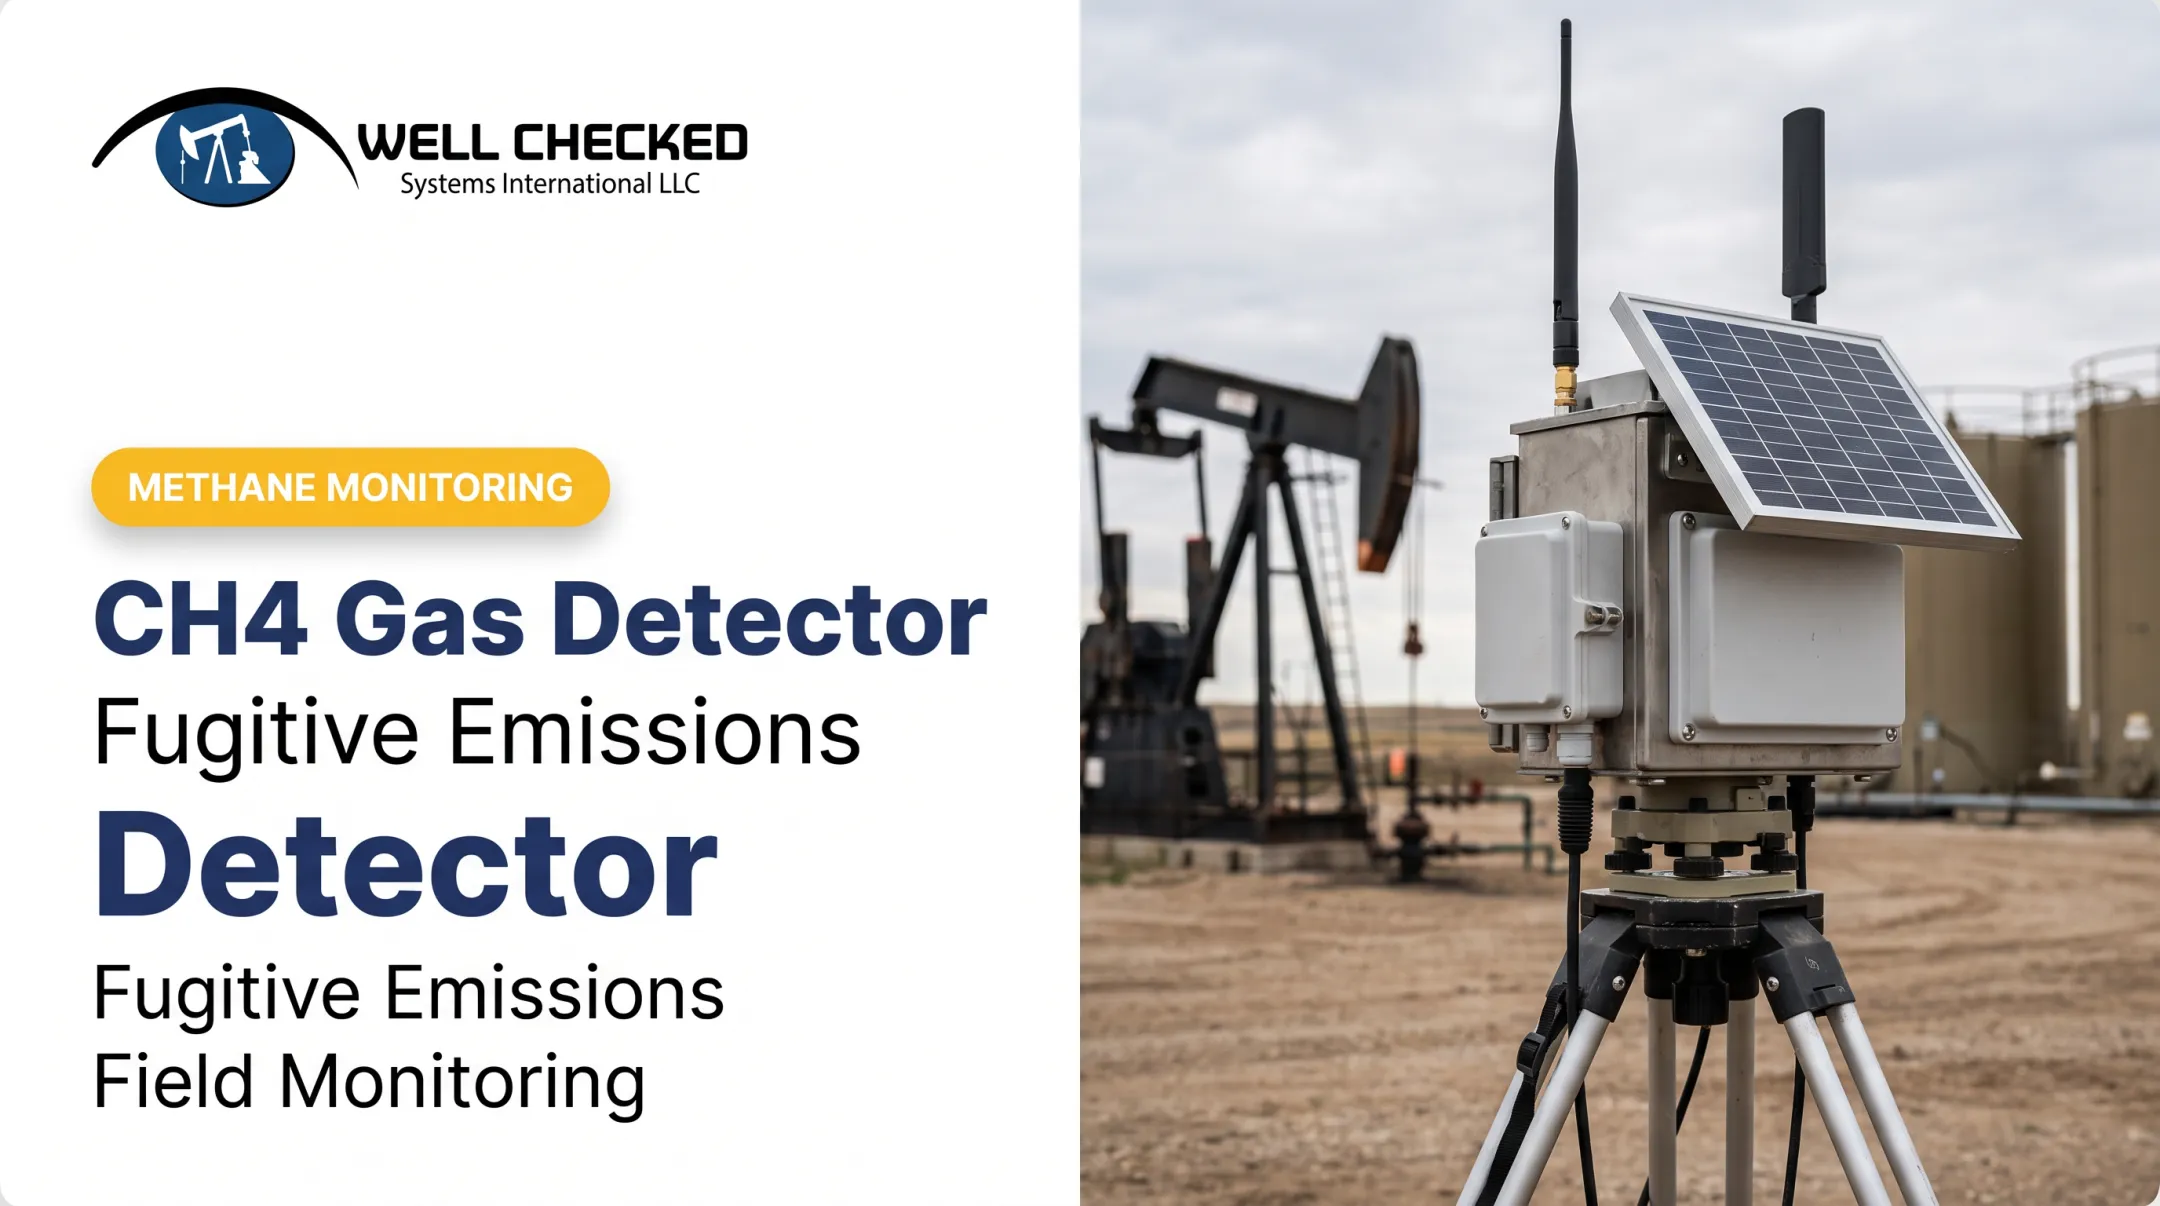
But these tools aren't a magic fix. Handheld cameras are expensive, require certified operators, and only capture a snapshot in time. That gap between quarterly inspections and continuous risk is exactly where the technology is evolving fastest.
This guide breaks down how optical methane detectors work, their real benefits, and where AI-driven autonomous monitoring platforms like Well Checked's Zensory.ai™ are pushing the category forward.
Key Takeaways
- Infrared absorption makes invisible methane leaks visible without contact sampling
- Traditional OGI cameras are accurate, but they demand certified technicians and heavy upfront investment
- AI-enabled continuous monitoring cuts false alarms and speeds up defensible compliance response
- Multi-sensor platforms (visual, acoustic, optical gas imaging) outperform single-sensor detection
What Is an Optical Methane Detector and How Does It Work?
An optical methane detector identifies gas leaks using infrared light absorption rather than physical contact with the gas. EPA Appendix K describes optical gas imaging (OGI) as a method for determining the presence and location of leaks, not necessarily a direct emission-rate measurement.
The Core Components
Most systems share a similar build:
- Infrared light source or ambient thermal contrast — provides the radiation methane absorbs
- Scene or sample chamber — the field of view or gas cell being analyzed
- Spectral filter — isolates the specific wavelength band where methane absorbs
- Detector array — converts absorption differences into a visible image or reading
How Detection Actually Happens
- Infrared radiation passes through or reflects off the scene.
- Methane molecules absorb radiation at specific wavelengths: 3.2-3.55 µm (MWIR), 7.2-8.3 µm (LWIR), and 2.31-2.39 µm (SWIR).
- The camera or sensor renders that absorption as a visible plume or a concentration value.
Passive OGI (thermal imaging) shows a moving plume against a warmer or cooler background. That contrast makes it effective for spotting and locating a leak visually.
Active laser-based detection (TDLAS) scans a specific absorption line with a diode laser and measures attenuation. It typically returns a path-integrated concentration rather than an image.

Why infrared over catalytic, semiconductor, or electrochemical sensors? Optical methods win on three fronts:
- No direct gas contact required
- High selectivity to methane’s absorption signature
- Remote, non-contact coverage across a wide facility footprint
Are There Optical Methane Detectors Available Commercially?
Yes. The market includes several categories:
- Handheld cooled and uncooled OGI cameras
- Fixed, continuous OGI units mounted at facilities
- Laser-based (TDLAS) detectors for stand-off measurement
- Drone- and satellite-mounted systems for aerial screening
- Multi-sensor AI platforms combining optical, acoustic, and video data
One caution: owning a commercial camera doesn’t automatically satisfy EPA compliance. Approval covers the technology and the operating protocol together, not the hardware alone.
Key Benefits of Optical Methane Detectors
Optical detection delivers value well beyond simply "seeing" gas.
- Catches leaks early — before a small issue becomes an expensive repair or a reportable event
- Documents compliance — visual and quantitative records support EPA and state submissions
- Improves worker safety — reduces the need for close-proximity manual inspection near pressurized equipment
- Enables higher-frequency monitoring — fills the gaps OOOOb leaves between quarterly AVO checks and periodic OGI surveys
- Lowers long-term costs — catching a small leak early beats emergency response to a large failure
- Strengthens ESG credibility — measurable, documented emissions data holds up better with investors and regulators
The gap between periodic inspection and reality matters more than most operators realize. A well-cited Science study found US oil-and-gas supply-chain methane emissions ran approximately 60% higher than EPA's inventory estimate, with abnormal operating conditions driving much of that gap. Quarterly snapshots simply miss a lot of activity happening in between.
Continuous monitoring keeps that visibility open between OGI surveys so abnormal events get caught when they start—not weeks later at the next scheduled inspection.
Innovations Driving the Next Generation of Methane Detection
The industry is shifting from handheld, technician-driven inspections toward always-on autonomous systems that watch a site around the clock.
Long-Wave Infrared (LWIR) Cameras
LWIR technology enables day-and-night methane and VOC detection without the price tag of traditional mid-wave infrared (MWIR) systems. Well Checked's Zensory.ai™ platform uses LWIR cameras that run at roughly one-third the cost of comparable MWIR solutions. That gap matters when you scale monitoring across hundreds of remote wellsites instead of a handful.
AI and Machine Learning Integration
Raw imaging generates noise. Every process vent, flare flicker, or steam plume can trigger a false alarm if a system isn't trained to know the difference. AI site-learning models solve this by building a site-specific baseline of normal activity, then flagging genuine deviations.
Zensory.ai™ runs this learning cycle in about two days per site, using fused data from three sensor types:
- High-resolution video with AI object detection (360° coverage)
- LWIR optical gas imaging for continuous methane/VOC detection
- Acoustic sensors that catch abnormal equipment sounds signaling malfunction
The platform processes 1,500+ videos per site, per day at production scale. Across the industry, single-sensor point detection is giving way to sensor fusion: sight, sound, and gas imaging validate each other before an alert reaches a human.

Optical Methane Detector Costs and Placement Considerations
Handheld and fixed OGI cameras carry meaningful upfront costs tied to detector cooling, certified optics, hazardous-area ratings, and quantification software. Continuous autonomous platforms change the economics. Instead of one capex-heavy purchase, operators can choose:
- Outright purchase
- Lease arrangements
- Subscription plans, often starting with a fixed-fee pilot before full rollout
Where Should an Optical Methane Detector Be Placed?
Placement should prioritize equipment with the highest emission risk:
- Compressors and connectors
- Valves and flanges
- Storage tanks
- Wellheads and pneumatic devices
Sensor positioning needs to account for prevailing wind direction and line-of-sight requirements. A sensor pointed the wrong way, or blocked by tank structures, misses the plume entirely. EPA's own OGI protocol requires imaging equipment from at least two angles for exactly this reason.

From Detection to Defensible Compliance
Detection alone doesn't satisfy a regulator. Operators need quantification and documentation that stands up under EPA 40 CFR Part 60 Subpart OOOOb, OGMP 2.0, and ESG frameworks like SASB and TCFD.
A tiered approach (detect → validate → quantify) reduces false-alarm fatigue and supports an acknowledge-dispatch-mitigate response within regulatory timeframes.
Well Checked's three-tier architecture maps directly to that workflow:
| Tier | Function |
|---|---|
| Zentinal Ops™ | Detects — visual and acoustic intelligence flags potential anomalies |
| Zentinal Core™ | Validates — multi-sensor fusion filters false alarms, confirms true fugitive events |
| Zentinal IQ™ | Quantifies — estimates volume, duration, and rate for regulatory-ready reporting |
Only after Core validates an event does IQ generate quantified logs, trend reports, and compliance-formatted documentation for EPA, OGMP 2.0, SASB, and TCFD submissions. That validate-before-quantify sequence is what makes the resulting data defensible in an audit.

Frequently Asked Questions
How much does an optical methane detector cost?
Costs vary widely by category, from lower-cost laser detectors to handheld OGI cameras with certified optics and cooling. Continuous monitoring platforms typically use subscription or pilot-based pricing rather than a single hardware purchase.
How does an optical methane detector work?
It uses infrared light absorption — methane absorbs radiation at specific wavelengths, and the detector renders that absorption as a visible plume or a concentration reading. Passive OGI shows imagery; laser-based TDLAS returns a measured value.
Where should an optical methane detector be placed?
Prioritize high-risk equipment like compressors, valves, tanks, and wellheads. Sensor positioning should account for prevailing wind direction and clear line-of-sight to the equipment being monitored.
What types of optical methane detectors are available?
Commercial options include handheld and fixed OGI cameras, laser-based detectors, drone or satellite systems, and AI-driven multi-sensor platforms like Zensory.ai™.
What is the difference between optical gas imaging and laser methane detection?
OGI shows a visual plume for locating and confirming a leak by sight. Laser-based (TDLAS) detection returns a quantitative, path-integrated concentration measurement rather than an image.
How often should methane detection surveys be conducted?
Under EPA OOOOb, frequency ranges from quarterly AVO checks at simple sites to bimonthly AVO plus quarterly OGI at equipment-intensive facilities. Continuous monitoring closes the gaps between those periodic surveys.