The operational problem is straightforward: distributed wellsites, limited field staff, spotty connectivity, and safety exposure on every drive out. Miss an abnormal condition between visits, and it sits unresolved for days. This article explains how SCADA monitoring actually works, where it fits across upstream operations, and how complementary multi-sensor monitoring can extend visibility beyond what conventional SCADA instrumentation captures.
Key Takeaways
- SCADA monitoring collects, visualizes, and alarms on process data through PLCs, RTUs, and supervisory software.
- Field devices feed controllers, networks move the data, and software surfaces dashboards, trends, and alarms.
- Real-time visibility matters only when alerts reach the right person and trigger a documented response.
- Upstream operators pair SCADA with visual, acoustic, and gas inputs to work by exception—not routine site visits.
What Is SCADA Monitoring?
SCADA stands for Supervisory Control and Data Acquisition. According to NIST's Guide to Operational Technology Security, SCADA systems gather and process data while applying operational oversight across long distances. They connect field RTUs and PLCs, a supervisory server, an HMI, and a historian into one system.
That full stack is the point. SCADA monitoring isn't a single screen you glance at. It includes data acquisition, status interpretation, alarming, historical recordkeeping, and, where configured, supervisory commands sent back to the field.

What SCADA monitoring is NOT:
- A single PLC running local logic
- One HMI screen showing current values
- A standalone camera system
- An isolated IoT sensor with no supervisory layer
- A replacement for field controls or maintenance crews
Deployment Models Vary by Site Reality
The right architecture depends on remoteness, connectivity, latency tolerance, and cybersecurity needs. Emerson's comparison of on-premises versus cloud SCADA frames the tradeoff clearly for dispersed assets.
| Architecture | How it works |
|---|---|
| On-premises/local | Software and infrastructure stay under operator control at the site or regional office |
| Centralized wide-area | Field RTUs/PLCs relay to a control center, often with primary and backup servers |
| Cloud-hosted | Provider-managed platform, useful for widely dispersed remote assets |
| Edge plus cloud | Local device polls field equipment and buffers data through outages before syncing to the cloud |
None of this makes SCADA obsolete alongside newer IIoT and AI tools. It remains the operational framework that ties field signals, control logic, human decisions, alarms, and historical data together.
How Does SCADA Monitoring Work?
Think of SCADA as a sequence: measure conditions, collect signals, transmit information, interpret status, notify personnel, support action, record the outcome. Each stage depends on the one before it.
Field Devices and Data Collection
Sensors, meters, switches, and cameras measure pressure, temperature, flow, tank level, power status, valve position, and equipment state. Signals typically fall into three categories:
- Analog — continuous values like pressure or flow rate
- Digital — on/off states such as a pump running or stopped
- Event-based — change-of-state triggers, like a door opening or a breaker tripping
Sensor placement, calibration, and data quality determine whether everything downstream is trustworthy. A miscalibrated pressure transmitter produces unreliable data that leads to poor decisions.
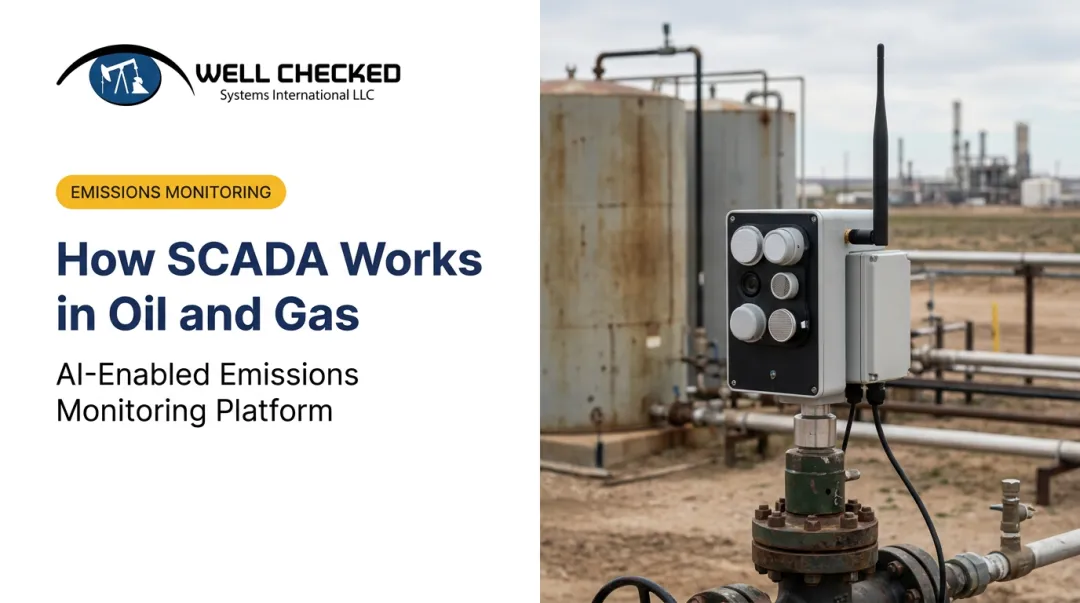
For upstream sites, conventional process data (pressure, flow, tank level) tells only part of the story. Visual, acoustic, and gas-detection inputs catch conditions traditional instrumentation misses. That includes a compressor developing an abnormal vibration signature, or a fugitive leak with no pressure drop large enough to trip a standard alarm.
PLCs, RTUs, and Edge Processing
PLCs and RTUs interface directly with field devices, apply programmed logic, buffer data locally, and relay status upward to the SCADA system. NIST notes that PLCs may perform local closed-loop control while RTUs primarily monitor and relay.
At a remote wellsite, edge processing matters because:
- It keeps data collection running during communications outages
- It applies defined logic locally instead of waiting on a round-trip to a central server
- It reduces unnecessary transmission of raw data over limited-bandwidth links
Supervisory monitoring at the SCADA level doesn't automatically change equipment behavior. An alarm tells an operator something needs attention; it doesn't trigger automatic control action unless that logic was built into the PLC.
Communications and Supervisory Software
Networks carrying field data include wired Ethernet, radio, cellular, satellite, and fiber, often in combination. Emerson documents oil-and-gas SCADA deployments using licensed and unlicensed radio, cellular, and satellite links, with alarm buffering and historical data backfill after a disconnection.
SCADA software then normalizes incoming signals, displays live status, stores historical trends, and consolidates data from multiple sites into one view.
Example: A tank battery's pressure sensor reads outside its normal band. The RTU flags the deviation, the network carries the alarm to the central server, and the SCADA software displays it on the operator's HMI within seconds, complete with a trend showing how the pressure moved over the preceding hour.
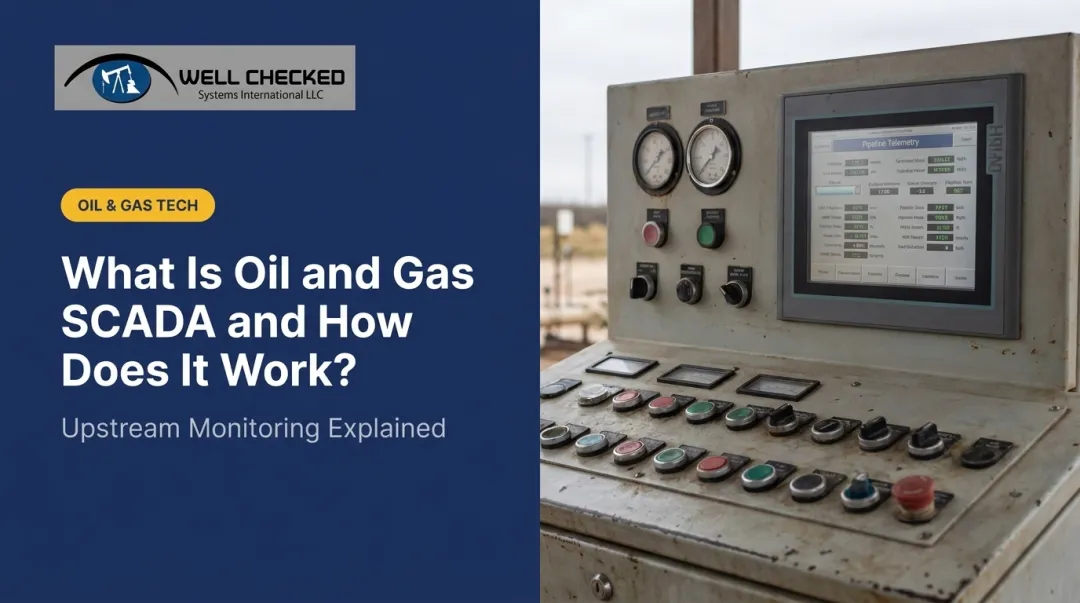
Alarms, HMI, and Operator Response
HMI screens, alarm priorities, trends, and event logs help operators separate routine noise from conditions needing immediate attention. The ANSI/ISA-18.2 standard governs alarm identification, rationalization, and lifecycle management for exactly this reason.
An effective response loop looks like this:
- Validate the alert against other available data
- Acknowledge it in the system
- Determine severity and likely cause
- Dispatch or adjust operations as needed
- Document the action taken
- Verify the issue is resolved

ISA's 2021 analysis of alarm management cites a typical healthy priority distribution of roughly 5% high, 15% medium, and 80% low. When that ratio skews toward high-priority alarms, it usually signals poor threshold configuration rather than genuinely urgent conditions everywhere.
Avoid alarm flooding. Deadbands, escalation rules, role-based routing, and periodic alarm reviews keep the system usable instead of noisy.
Historical Data and Continuous Improvement
Historians store RTU data and alarm events over time, supporting trend analysis, maintenance planning, root-cause investigation, and performance comparisons across sites. That continuous record answers questions like: Is this pump's vibration trending upward over the last six months? Did the repair actually fix the recurring pressure drop?
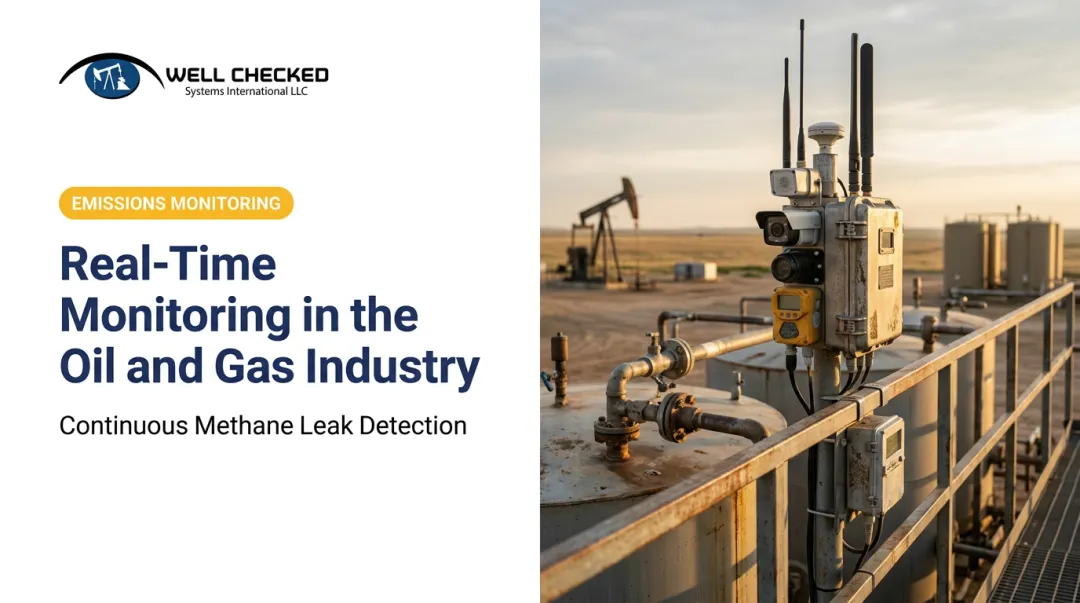
This is where complementary monitoring sits alongside conventional SCADA data. Well Checked's Zensory.ai™ platform layers visual, acoustic, and Long-Wave Infrared gas-detection intelligence on top of standard operational data. It does not replace a site's PLC or SCADA controls; it adds context.
- Zentinal Ops™ delivers 360° visual and acoustic site intelligence
- Zentinal Core™ filters false alarms across sensor streams and flags true fugitive anomalies
- Zentinal IQ™ quantifies validated events for regulatory-defensible reporting
The platform connects to existing SCADA environments through a read-only published API. Alerts reach the SCADA system, the Well Checked Dashboard, email, and text simultaneously, without touching control logic.
Where Is SCADA Monitoring Used in Upstream Oil and Gas?
Monitoring points vary by asset design, but common upstream deployments cover:
- Wellsites and wellpads — pressure, flow, power status, valve position
- Tank batteries — fluid level, transport status, saltwater-disposal monitoring
- Gathering systems and pipelines — pressure, temperature, remote valve operation
- Compressor stations — run status, and at larger stations, pressure and flow
- Artificial-lift equipment — rod pumps, plunger lift, gas lift analytics
- Water handling — tank instrumentation tied to controllers and RTUs
One Emerson-documented deployment in North and South Texas connected up to 12 gas wells spaced 1.5 miles apart, cutting the number of long-haul radios needed and avoiding trenching costs. That's one field example, not a universal benchmark. Deployment size and savings depend heavily on site layout.
Integration With Adjacent Systems
SCADA data increasingly feeds adjacent workflows without controlling them:
- Maintenance management systems
- Production accounting platforms
- Historian and enterprise reporting tools
- Emissions-management workflows
- Cybersecurity monitoring layers
That distinction matters: data sharing across systems is not the same as one system directly controlling another. Emissions workflows make the boundary concrete. Process data informs the response, while dedicated detection supplies the evidence regulators expect.
Emissions Monitoring: Where SCADA Data Meets Gas Detection
EPA's 2024 rule under 40 CFR Part 60 Subpart OOOOb set performance standards for new and modified methane sources. SCADA process data alone doesn't satisfy these requirements. It needs to be paired with recognized detection methods.
Combining SCADA data with optical gas imaging, acoustic sensing, and visual analytics helps operators:
- Identify abnormal events in near real time
- Establish event duration for defensible reporting
- Reconcile source-based estimates with independent site-level measurement, consistent with OGMP 2.0 Level 4/5 frameworks
Well Checked applies that model for operators managing EPA methane rule exposure or OGMP reporting obligations. Zentinal IQ™ produces EPA-format compliance logs and quantified emissions data only after Zentinal Core™ validates the underlying event, keeping detection and quantification as separate, defensible steps.

Evaluation Checklist for Operators
Before selecting or expanding a SCADA monitoring program, run through:
- Coverage — Does it reach every critical asset, not just the largest ones?
- Communications resilience — What happens during an outage?
- Alarm performance — Is the priority mix reasonable, or is everything flagged "high"?
- Edge capability — Can the system function without constant connectivity?
- Integration options — Does it connect to maintenance, historian, and ESG platforms?
- Cybersecurity controls — Are network zones and boundary firewalls in place, per NIST SP 800-82?
- Scalability — Can it expand across basins without redesign?
- Response workflow clarity — Is there a documented acknowledge-dispatch-verify process?
Conclusion
SCADA monitoring supports real-time operations by connecting field measurements, controllers, communications, software, alarms, operators, and historical records into a single feedback loop. None of those pieces work in isolation.
For upstream teams, that loop pays off when you identify the exceptions that matter, respond safely, verify the fix worked, and improve decisions across assets you can't visit every day.
Conventional SCADA handles the core process view. Complementary multi-sensor intelligence — combining sight, sound, and gas detection — extends that visibility into equipment behavior and emissions events that traditional instrumentation alone won't catch.
Frequently Asked Questions
What should operators evaluate before deploying SCADA?
Asset count, sensor and controller requirements, communications coverage at remote sites, software architecture, integration with existing systems, cybersecurity, installation and ongoing support. Evaluate the full lifecycle, not any single component in isolation.
What is a SCADA monitoring system?
A SCADA monitoring system combines hardware, software, communications, and an operator interface to collect, display, alarm, record, and supervise industrial process data across distributed assets.
What does SCADA stand for?
Supervisory Control and Data Acquisition. Each term reflects a function: supervisory oversight, control capability, and continuous data collection across field equipment.
How does SCADA support real-time operations?
It collects field data continuously, presents live status on operator screens, triggers prioritized alarms, supports remote decision-making, and preserves event history for follow-up investigation.
What is the difference between SCADA and PLCs?
A PLC typically handles local machine or process control at a single point. SCADA supervises, visualizes, records, and coordinates information across multiple PLCs, RTUs, and assets simultaneously.