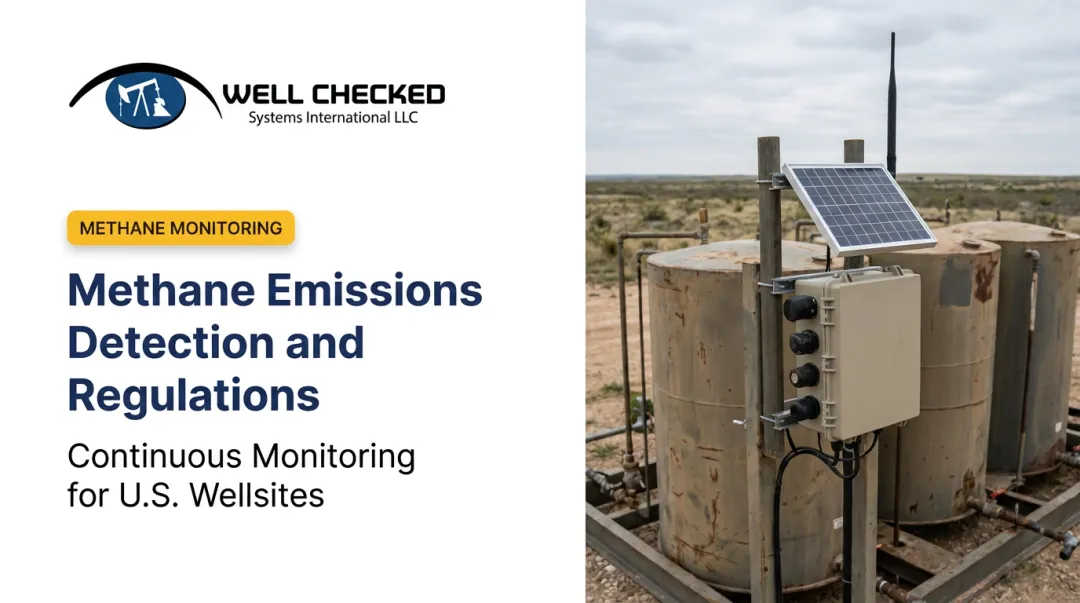
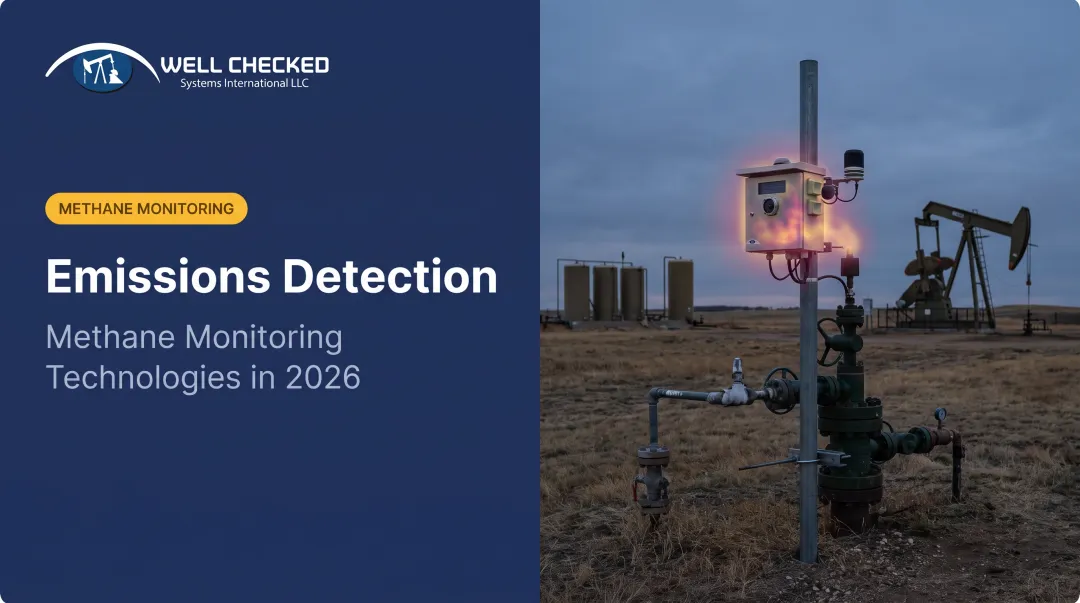
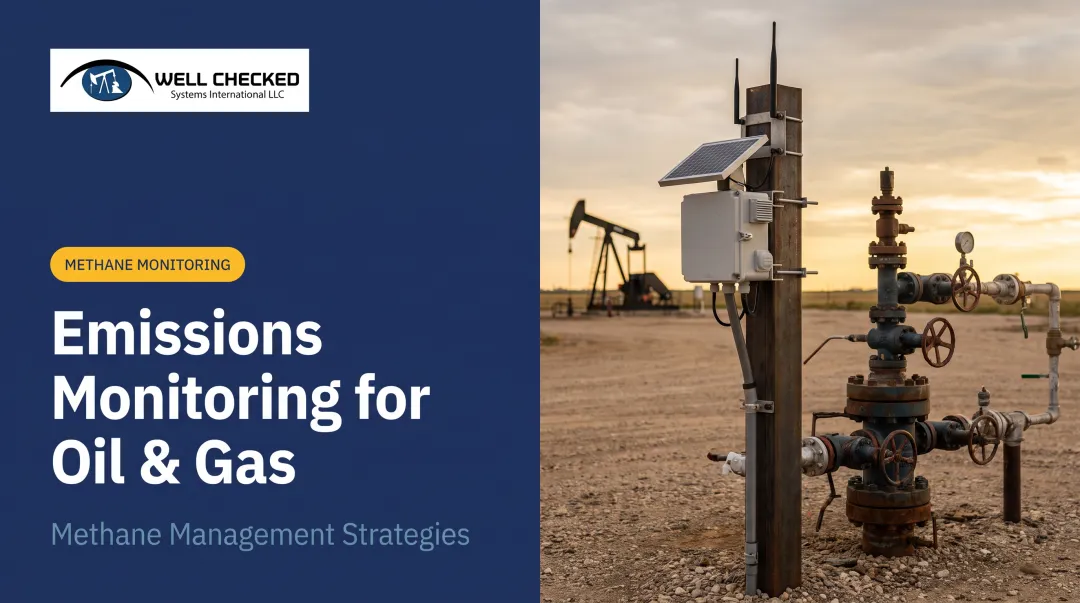
The core problem: quarterly LDAR surveys and pumper routes were built for a slower regulatory era. They're expensive, they miss intermittent leaks between visits, and they can't produce the timestamped, quantified records regulators and investors now expect.
This article covers the 2026 regulatory landscape, the shift to continuous multi-sensor detection, operational fixes that complement technology, and how to build a data program that survives an audit.
Key Takeaways
- EPA's OOOOb and OGMP 2.0 Level 4/5 are converging on measured, not estimated, methane data for 2026
- Continuous multi-sensor monitoring is replacing quarterly LDAR as the compliance baseline
- Defensible reporting requires quantified duration and volume, not just detection alerts
- Pairing detection technology with process fixes (leak-resistant equipment, predictive maintenance) drives the best ROI
- operators need one data architecture that satisfies EPA, OGMP 2.0, SASB, and TCFD at once
The 2026 Regulatory Landscape for US Upstream Operators
Subpart OOOOb gives operators two compliance paths, and the choice matters for 2026 planning.
Periodic pathway: Survey frequency scales with site complexity:
- Single-wellhead sites: quarterly screening
- Compressor stations: monthly screening plus quarterly OGI
A temporary allowance for quarterly screening under certain alternative methods ends March 9, 2026. After that date, the standard rule-table frequency applies.
Continuous pathway: Operators must meet ongoing monitoring thresholds:
- Record a valid methane emission rate at least every 12 hours
- Run device health checks twice per six-hour block
- Transmit data every 24 hours
- Detect down to 0.40 kg/hr
Both paths also share common follow-up rules:
- Retain records for 5 years
- Investigate confirmed detections within 5 days
- Complete repairs and resurvey, generally within 30 days

Beyond EPA: OGMP 2.0, SASB, and TCFD
OGMP 2.0 Level 4 requires source-level direct measurement. Level 5 adds site-level reconciliation: source measurements must match a site total within a stated uncertainty range. Members get three years (operated assets) or five years (non-operated) to reach Gold Standard reporting.
Publicly traded E&Ps face a second layer: SASB's Oil & Gas E&P standard calls for disclosed Scope 1 emissions, methane intensity, and the percentage of production covered by emissions-limiting regulation. TCFD adds governance and risk-process disclosure on top. ESG teams are increasingly being asked to substantiate these numbers with underlying data, not modeled estimates.
Globally, fossil fuels account for nearly one-third of human-caused methane emissions, according to the IEA's 2025 Global Methane Tracker. Regulators and investors cite that figure when pressing operators for measured data rather than modeled estimates.
State-Level Complexity operators can't rely on one compliance template:
- Colorado: revised Regulation 7 in 2025, targeting pneumatic controllers and pumps
- New Mexico: Methane Waste Rule requires at least 98% gas capture by December 31, 2026
- Pennsylvania: finalizing its own state methane plan based on EPA's model guidelines
Each state layers its own frequency and reporting quirks on top of federal rules, which is exactly why standardizing data collection across basins matters.
Core Strategy 1: Continuous, Multi-Sensor Emissions Detection
Point-in-time inspections have a structural blind spot: they only catch what's leaking at the moment someone looks. A 2025 peer-reviewed study found that for short OGI-style surveys, the probability of catching an intermittent emission within a year fell below 30%. Quarterly visits simply aren't built to catch transient leaks.
Combining Sensors to Cut False Alarms
The industry is converging on three sensor types working together instead of alone:
- Optical gas imaging (LWIR): continuous day/night methane and VOC detection
- Acoustic sensing: flags abnormal equipment sound signatures tied to malfunction
- Visual AI: 360° video coverage with object detection for site anomalies
Well Checked's Zensory.ai™ platform structures this as a three-tier stack:
- Zentinal Ops™: visual and acoustic intelligence, with high-resolution cameras and AI-based sound analysis processing over 1,500 videos per site per day
- Zentinal Core™: layers in LWIR OGI and filters false alarms using a site-specific AI baseline built over roughly two days
- Zentinal IQ™: quantifies only the events Core has validated

That sequencing matters. Operating by exception means reviewing only true anomalies, not sending crews out on a fixed route whether anything is wrong or not.
LWIR cameras run at roughly one-third the cost of traditional mid-wave IR solutions, making continuous OGI coverage more economically viable at scale than it was a few years ago.
Response Time as a Compliance Benchmark
Detection alone doesn't satisfy regulators. Response does. A 24-hour acknowledge-dispatch-mitigate window is emerging as the practical benchmark for minimizing exposure once a validated fugitive event is confirmed. Well Checked's Appalachian Basin monitoring with a large Appalachian operator uses this exact workflow, pushing alerts through dashboard, email, text, and SCADA integration.
Operational and Process-Level Strategies
Detection technology alone won't fix an underlying equipment problem. Pairing it with process changes is where the real ROI shows up.
Equipment upgrades that reduce baseline emissions:
- Retrofit or replace high-bleed pneumatic controllers (EPA estimates these account for 13% of sector methane emissions)
- Optimize flaring and venting practices at the design stage, not after the fact
- Prioritize leak-resistant valves and connectors during workovers
A 2025 S&P Global analysis found pneumatic controller methane emissions per unit of energy fell 60% (16 g/MJ to 6 g/MJ) between 2015 and 2022, a trend tied to equipment turnover rather than any single intervention.

Predictive maintenance covers the failure-driven side of the same problem. Acoustic AI monitoring flags abnormal equipment sound signatures before failures cause unplanned venting. It does not replace a maintenance program: it tells crews where to look first, so a leak is not left running for weeks until the next scheduled inspection.
Building a Defensible Data and Reporting Infrastructure
Regulators aren't just asking "did you detect this?" anymore. They want to know how much, for how long, and what you did about it.
Continuous, timestamped records beat periodic snapshots for one simple reason: a quarterly LDAR report can't demonstrate what happened in the other 89 days. EPA's rolling downtime and 24-hour transmission requirements exist precisely because gaps in the record are gaps in defensibility.
Quantification Comes After Validation
Well Checked separates detection from quantification so only validated events reach the compliance file. Zentinal Core™ confirms a genuine fugitive emission, filtering out normal process activity, before Zentinal IQ™ calculates volume, duration, and rate using LWIR OGI plume analysis. That sequence keeps false positives out of the compliance record.
Quantified duration and volume also feed a practical business decision: is this a repair or a replace situation? A component leaking a small volume intermittently is a different capital decision than one hemorrhaging gas continuously.
One Data Structure, Multiple Frameworks
Operators don't have the bandwidth to build separate reporting pipelines for each framework. A single validated-event record can feed:
| Framework | What it needs |
|---|---|
| EPA OOOOb | Compliance logs, alternative-monitoring submissions |
| OGMP 2.0 L4/L5 | Measurement-based source and site-level data |
| SASB Oil & Gas E&P | Scope 1 and methane intensity metrics |
| TCFD | Climate risk and performance disclosure |
Because Zentinal IQ™ outputs CSV/JSON, API access, and SCADA historian integration, that same validated record can populate all four without separate data-collection efforts.

Edge Computing for Remote Sites
Remote wellsites don't always have reliable connectivity. Onsite edge computing processes video, LWIR, and acoustic data locally, storing it until a connection is available to sync with the dashboard. That means monitoring keeps running, and the audit trail stays intact, even when the network doesn't cooperate.
Common Challenges Operators Face in 2026
Three pressures keep showing up for upstream operators heading into 2026:
- Alert fatigue from legacy systems. Older tools treat every signal as suspicious, burying real fugitive leaks in noise from normal process emissions. Operators start ignoring alerts — the opposite of what monitoring should deliver.
- Cost and safety of pumper routes. Well Checked's data puts route-based site visits at $1 million to more than $5 million annually for mid-sized to large operators. That figure excludes the safety exposure of sending crews on repetitive drives across remote terrain in all weather.
- Standardizing across basins. Colorado, New Mexico, and Pennsylvania each layer different monitoring frequencies and reporting quirks on top of federal rules. Operators need one flexible monitoring architecture, not a separate compliance process per state.
Frequently Asked Questions
How much CO2 is in 1 barrel of oil?
Combustion of a barrel of crude oil emits roughly 0.43 metric tons of CO2, per EPA's greenhouse gas equivalencies reference. This varies by crude type and end use, so check current EPA/EIA conversion factors for precise figures.
Are we actually reducing emissions?
Progress is mixed. Methane intensity has improved in some basins, and reported Permian absolute emissions fell in 2024, but measurement-based reporting under OGMP 2.0 is still revealing gaps between operator estimates and actual emissions.
What is the EPA methane rule and who does it apply to?
40 CFR Part 60 Subpart OOOOb applies to new, modified, and reconstructed oil and gas sources, requiring fugitive-emissions monitoring on a periodic or continuous basis. Operators can use an EPA-approved alternative monitoring pathway if it meets minimum detection-threshold requirements.
What is the difference between LDAR and continuous monitoring?
Traditional LDAR relies on quarterly or semiannual site visits using handheld instruments or OGI cameras. Continuous monitoring runs 24/7 through multi-sensor platforms, catching intermittent leaks that periodic surveys miss entirely.
How does OGMP 2.0 Level 5 differ from Level 4 reporting?
Level 4 requires direct source-level measurement across an operator's emission sources. Level 5 goes further, reconciling those source measurements against an independent site-level total within a defined uncertainty range.
What technologies are most effective for methane leak detection in 2026?
The strongest approach combines optical gas imaging, acoustic sensing, and AI-driven visual analysis in one platform. Multi-sensor systems catch what single-technology tools miss and filter out false alarms more reliably than any one method alone.