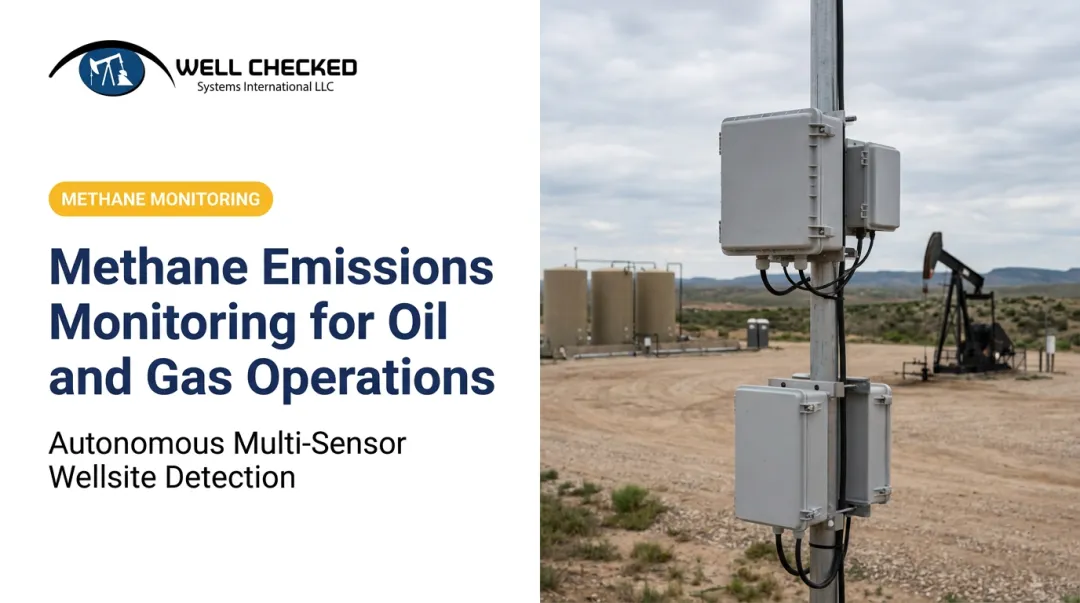
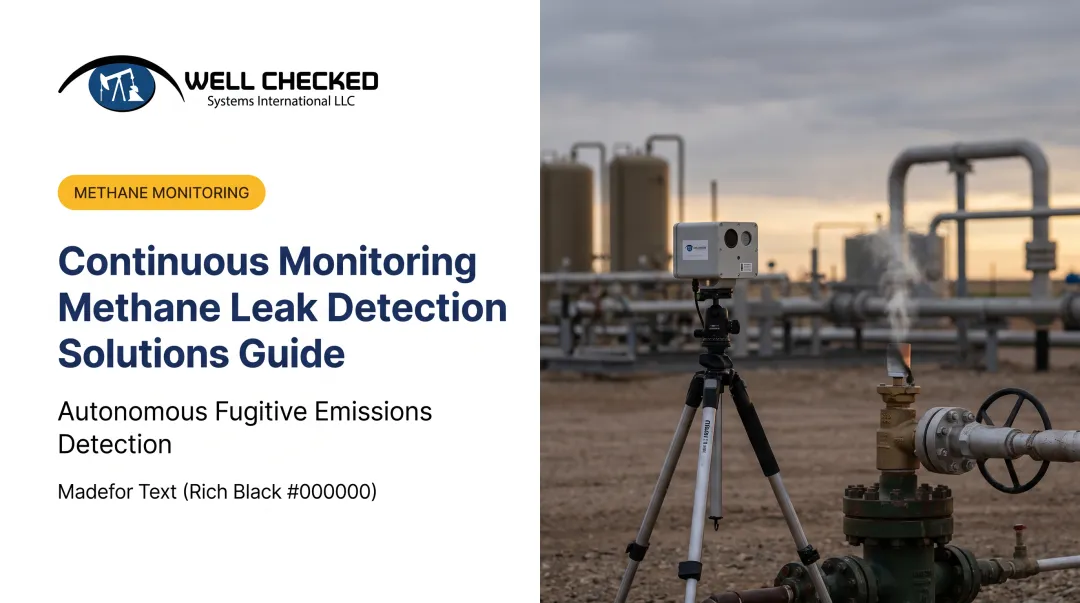
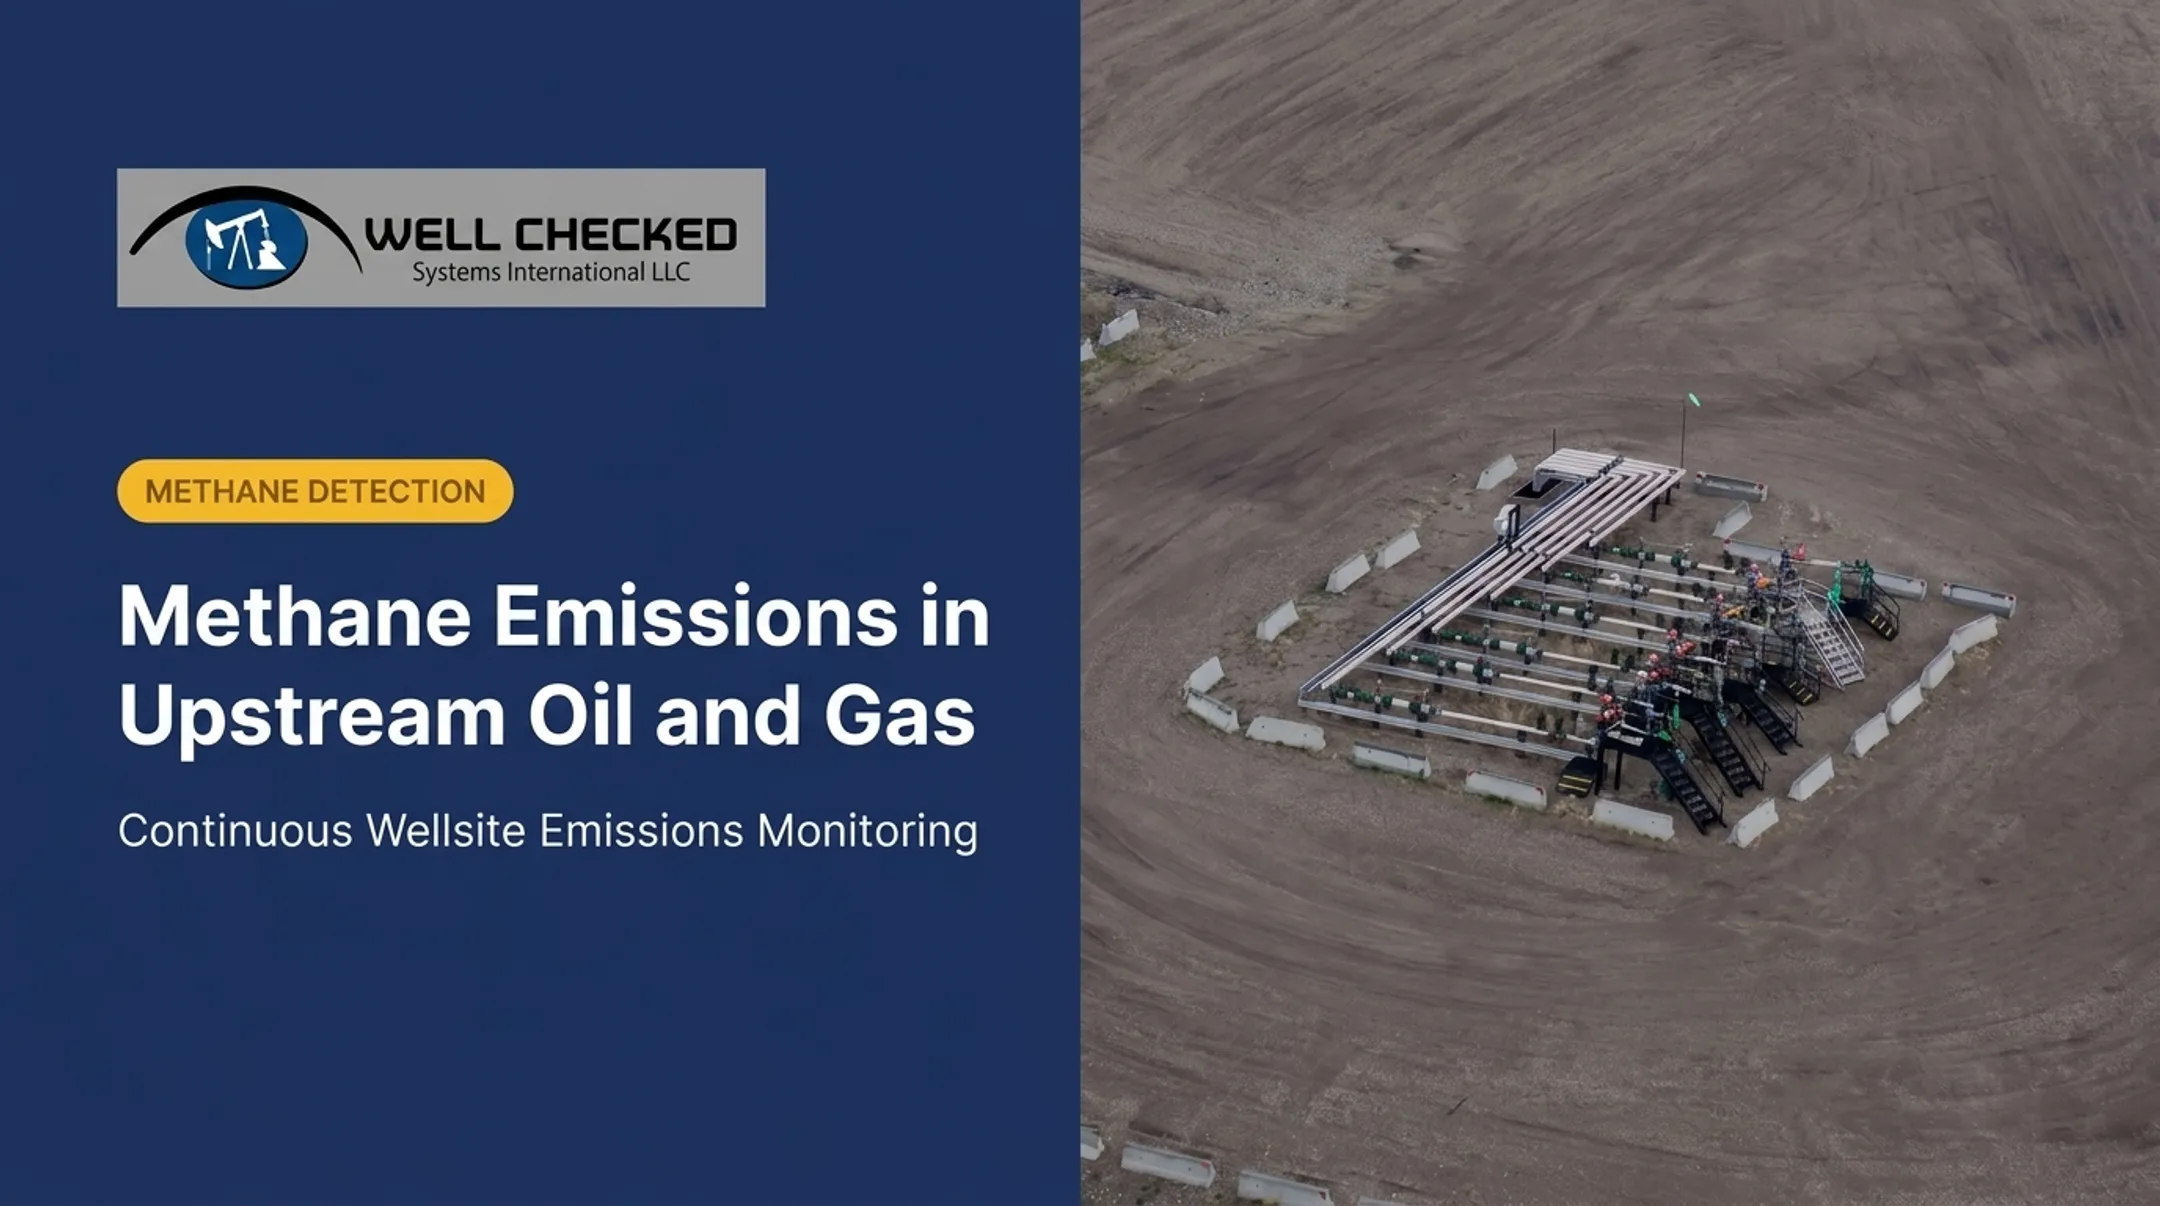
Methane comes from farms, landfills, and energy systems worldwide. But US upstream oil & gas operators face a narrower, sharper problem: specific equipment at specific wellsites, tied to specific EPA compliance deadlines and real financial exposure.
This article breaks down methane by major global source category, then zooms into the exact sources within oil & gas operations, and how modern monitoring finds them.
Key Takeaways
- Agriculture, energy, and waste dominate human-caused methane, with agriculture and energy leading globally.
- In oil and gas, methane escapes via venting, flaring, and fugitive leaks from tanks, pneumatics, compressors, and connectors.
- Continuous multi-sensor monitoring is replacing quarterly LDAR because it catches short, intermittent leaks.
- Source-level accuracy now drives EPA Subpart OOOOb and OGMP 2.0 compliance readiness.
Global Sources of Methane Emissions: The Big Picture
Over 60% of global methane emissions come from human activity, according to the Climate & Clean Air Coalition. That human-caused share splits across three major sectors:
- Agriculture — roughly 40%, driven by livestock and rice cultivation
- Fossil fuels — around 35%, split between oil and gas (23%) and coal (12%)
- Waste — about 20%, mostly landfills

The IEA's Global Methane Tracker puts the energy sector closer to 40% of human-caused methane, a difference that reflects varying study years and sector boundaries rather than a contradiction.
Those global shares set the frame. The US inventory tells a similar story — with sharper numbers operators can map to their own basins.
Agriculture and Livestock
Globally, livestock accounts for about 32% of human-caused methane, and rice cultivation adds roughly 8% more. In the US agriculture inventory, the split looks like this:
- Enteric fermentation — over a quarter of US agriculture-sector GHG emissions from cattle and other ruminants
- Manure management — roughly 14% more
- Rice cultivation — a smaller but still measurable share
Energy Sector (Oil, Gas, and Coal)
The EPA's 2022 methane source chart puts natural gas and petroleum systems at 30% of US methane emissions — the second-largest category behind agriculture when livestock sources are combined. Coal mining adds another 6%.
For upstream operators, that 30% is a national category total, not a single-well or single-basin figure. That national share is the backdrop operators are measured against.
Waste and Landfills
Municipal solid waste landfills sit at roughly 14.4% of US methane emissions, the third-largest source nationally. Anaerobic decomposition of buried organic waste generates methane for years after material enters the landfill.
Breaking Down Methane Emissions in Upstream Oil & Gas Operations
Upstream methane emissions generally fall into three buckets:
- Fugitive leaks — unintended releases from tanks, hatches, valves, and connectors
- Vented emissions — designed releases from pneumatic devices and similar equipment
- Flaring inefficiencies — methane that escapes when flares fail to destroy what they burn

Field studies show these sources behave very differently depending on equipment type and site conditions.
Storage Tank and Thief Hatch Leaks
Pressure-controlled storage tanks vent methane through faulty seals or improperly closed thief hatches. These leaks are often intermittent — a hatch that doesn't seal properly might only leak during specific pressure or temperature conditions.
That intermittency is exactly why they're hard to catch. A quarterly inspection might visit on a day the hatch happens to be sealed. Research from Alvarez et al. found that liquid-storage-tank hatches and vents accounted for 90% of high-emission plume sightings during aerial surveys, even though they represented a small fraction of total sites surveyed.
Pneumatic Device Venting
Gas-driven controllers and pumps vent methane as part of normal operation. That's by design, not malfunction. High-bleed devices are the biggest contributors in this category, and field data from a West Virginia production-site study found pneumatic devices responsible for roughly 61% of total measured methane at those sites.
A separate national study on production-segment emissions put pneumatic controllers at 38% of that segment's methane — consistently a top-tier source across study populations.
Flaring Inefficiencies
Flares are often assumed to destroy 98% of the methane they burn. Measured performance is lower.
A Science study covering basins responsible for over 80% of US flaring found actual destruction efficiency closer to 91.1%, with unlit and malfunctioning flares dragging the average down. That gap implies methane emissions from flaring five times higher than assumed, contributing an estimated 4-10% of total US oil-and-gas methane emissions.

Equipment Leaks: Valves, Flanges, and Connectors
Beyond tanks and flares, aging infrastructure and pressure fluctuations cause leaks at thousands of connection points across a typical wellsite. Individually small, these leaks add up. One national study found equipment-leak emissions running 60% higher than EPA's official inventory estimate — a sign that these sources are more common, and harder to catalogue, than assumed.
Wellhead, Casing Vent, and Rotating Equipment Emissions
Compressor seals, rod packing, and combustion slip generate methane in ways that don't always show up visually. These sources often need acoustic sensing or optical gas imaging, not a walk-up visual scan — the signature is far subtler than a hissing valve or a visible plume.
Why Pinpointing the Source Matters for US Operators
Knowing which component is leaking — and for how long — determines whether a repair pays off. A tank hatch leaking for six hours is a different ROI calculation than a compressor seal leaking continuously for six weeks.
Regulation has caught up to this logic:
- EPA's 40 CFR Part 60 Subpart OOOOb requires operators using alternative monitoring to show source-level data, not facility-wide estimates. Continuous systems must detect at least 0.40 kg CH4/h and record readings at least every 12 hours.
- OGMP 2.0 Level 4/5 requires measurement-based, source-attributed reporting rather than generic emission factors applied across a facility.
- SASB and TCFD frameworks push publicly traded operators toward more granular, defensible emissions disclosure tied to actual measurement.
Generic estimates no longer satisfy regulators or investors. Source-level data does.
How Continuous Multi-Sensor Monitoring Detects Emissions at the Source
Quarterly LDAR inspections were built for a world where leaks were assumed to be constant. They're not.
Research from a 2025 study published in ACS ES&T Air found that a 5-minute quarterly inspection has just a 9% median probability of catching an intermittent emission within a year. Even monthly 5-minute inspections only catch about 23%.
Continuous monitoring closes that gap. Well Checked's Zensory.ai™ platform combines high-resolution video, Long-Wave Infrared Optical Gas Imaging, and acoustic sensing to distinguish genuine fugitive emissions from normal process activity at the component level.
The platform works in three tiers:
- Zentinal Ops™ — delivers visual and acoustic site intelligence, scanning continuously rather than on a route schedule
- Zentinal Core™ — fuses sensor data, filters false alarms, and flags true fugitive anomalies after learning each site's normal baseline (a process that takes roughly two days)
- Zentinal IQ™ — quantifies validated events for regulatory-defensible reporting, formatted for EPA, OGMP 2.0, and ESG frameworks

This structure matters because it separates detection from confirmation. A flare flicker or routine pneumatic vent doesn't trigger a false alert; a genuine leak does.
Operationally, this enables an acknowledge-dispatch-mitigate response within 24 hours of a validated event. That window is designed to reduce EPA fine exposure before a small leak becomes a larger liability. Well Checked already runs this model as a continuous monitoring deployment in the Appalachian Basin.
Frequently Asked Questions
What are the main sources of methane emissions?
Agriculture (livestock and rice cultivation), energy production (oil, gas, and coal), and waste (mostly landfills) are the three largest human-caused sources. Natural sources like wetlands also contribute significantly.
What is the biggest source of methane emissions in the oil and gas industry?
Fugitive equipment leaks, pneumatic device venting, and flaring inefficiencies are consistently cited as top contributors in upstream operations. Which one dominates varies by site and equipment configuration.
How is methane different from CO2 in terms of climate impact?
Because methane is the product itself, reducing emissions recovers gas that would otherwise be vented. That makes near-term reductions both a compliance measure and a revenue measure.
Can methane leaks be detected before they become major emission events?
Yes. Continuous multi-sensor monitoring can flag early-stage anomalies, like a slowly failing seal, before they escalate into larger "super-emitter" events. Periodic inspections often miss this early window entirely.
What regulations require oil & gas operators to track methane emission sources?
EPA's 40 CFR Part 60 Subpart OOOOb is the primary federal rule, alongside voluntary frameworks like OGMP 2.0, SASB, and TCFD. All increasingly demand source-attributed, measurement-based data rather than facility-wide estimates.