Introduction
Wellsites don't leak on a schedule. A compressor seal can fail on a Tuesday and stay unnoticed until the next quarterly inspection rolls around. That gap is the problem.
A recent simulation using real production-site data found that five-minute optical gas imaging surveys had a median detection probability below 30% for intermittent emissions over a full year (ACS ES&T Air, 2025). That result held no matter how often the survey was scheduled. Periodic snapshots simply miss things.
Emissions monitoring management software closes that gap. It connects field sensors, automated detection, human review, quantification, and reporting into one traceable workflow. This article walks through how that workflow actually supports compliance, from the moment a sensor flags something unusual to the moment a report gets filed.
Key Takeaways
- Software covers the full compliance lifecycle—detection, validation, quantification, response, documentation, and reporting—so gaps do not show up at audit time.
- Multi-sensor data (video, LWIR optical gas imaging, acoustic) separates real fugitive events from normal site noise.
- Audit trails, timestamps, and asset records make every reported number defensible.
- One structured dataset supports EPA rules, state inventories, OGMP 2.0, SASB, and TCFD reporting.
What Is Emissions Monitoring Management Software?
Emissions monitoring management software collects emissions observations, sensor data, equipment context, response actions, calculations, and reporting evidence, then keeps them linked together. It's the connective tissue between "something happened at the wellsite" and "here's what we're reporting to the agency."
Traditional route-based LDAR inspections give you a snapshot every quarter or so. Compliance teams increasingly need something more continuous: an event history they can trace back to a specific sensor reading, a specific piece of equipment, and a specific reviewer decision.
How It Differs From Carbon Accounting and Standalone Sensors
Two common confusions worth clearing up:
- Carbon accounting software typically handles corporate-level Scope 1, 2, and 3 inventories. It's built for aggregation, not for tracing a single fugitive event back to its source.
- A standalone sensor or camera can detect a leak. It can't manage what happens after: the validation, the corrective action, the recordkeeping, or the reporting.
Emissions monitoring management software generally falls into a few overlapping categories:
- Detection and alerting — flags anomalies as they happen
- Multi-sensor monitoring — combines video, optical gas imaging, and acoustic data
- LDAR and response management — routes confirmed events to field teams
- Emissions quantification — turns a validated event into a reportable number
- Corporate reporting — feeds structured data into ESG and regulatory disclosures
Most upstream operators end up needing several of these working together rather than picking just one. Well Checked's Zensory.ai™ platform, for example, is built as a three-tier system:
- Zentinal Ops™ — visual and acoustic intelligence
- Zentinal Core™ — detection and false-alarm filtering
- Zentinal IQ™ — quantification and regulatory-ready reporting

The compliance case is strongest when the underlying data, calculation methods, and review steps match what a given rule or framework requires, whether that's an EPA methane-rule submission, a state inventory, or an OGMP 2.0 disclosure.
How Does Emissions Monitoring Management Software Support Compliance?
Compliance support follows a defined sequence: collect operational evidence, detect potential events, validate them, quantify emissions, assign corrective action, preserve the record, and generate reviewable outputs. Here's how each step works.
Collect and Contextualize Emissions Data
Raw sensor readings mean little on their own. The platform pairs continuous or recurring observations with asset inventories, equipment types, operating conditions, timestamps, site identifiers, and production or maintenance context.
For remote US upstream operations, missing a shared record forces environmental and operations teams to reconcile alerts, inspection notes, spreadsheets, and maintenance logs by hand. That delay is where evidence gaps start.
Data quality issues to watch for:
- Missing or interrupted sensor readings
- Inconsistent asset naming across systems
- Communications outages at remote sites
- Sensor calibration drift
- Unclear time synchronization
- Ambiguous ownership of a given record
Under EPA's Subpart OOOOb, monitoring requirements already vary by site configuration. Single-wellhead sites need at least quarterly AVO or another detection method, while sites with qualifying tank batteries or gas-driven controllers need bimonthly screening plus quarterly OGI or Method 21 (40 CFR § 60.5397b).
That variation alone makes standardized data collection worth getting right from day one.
Detect and Prioritize Potential Emissions Events
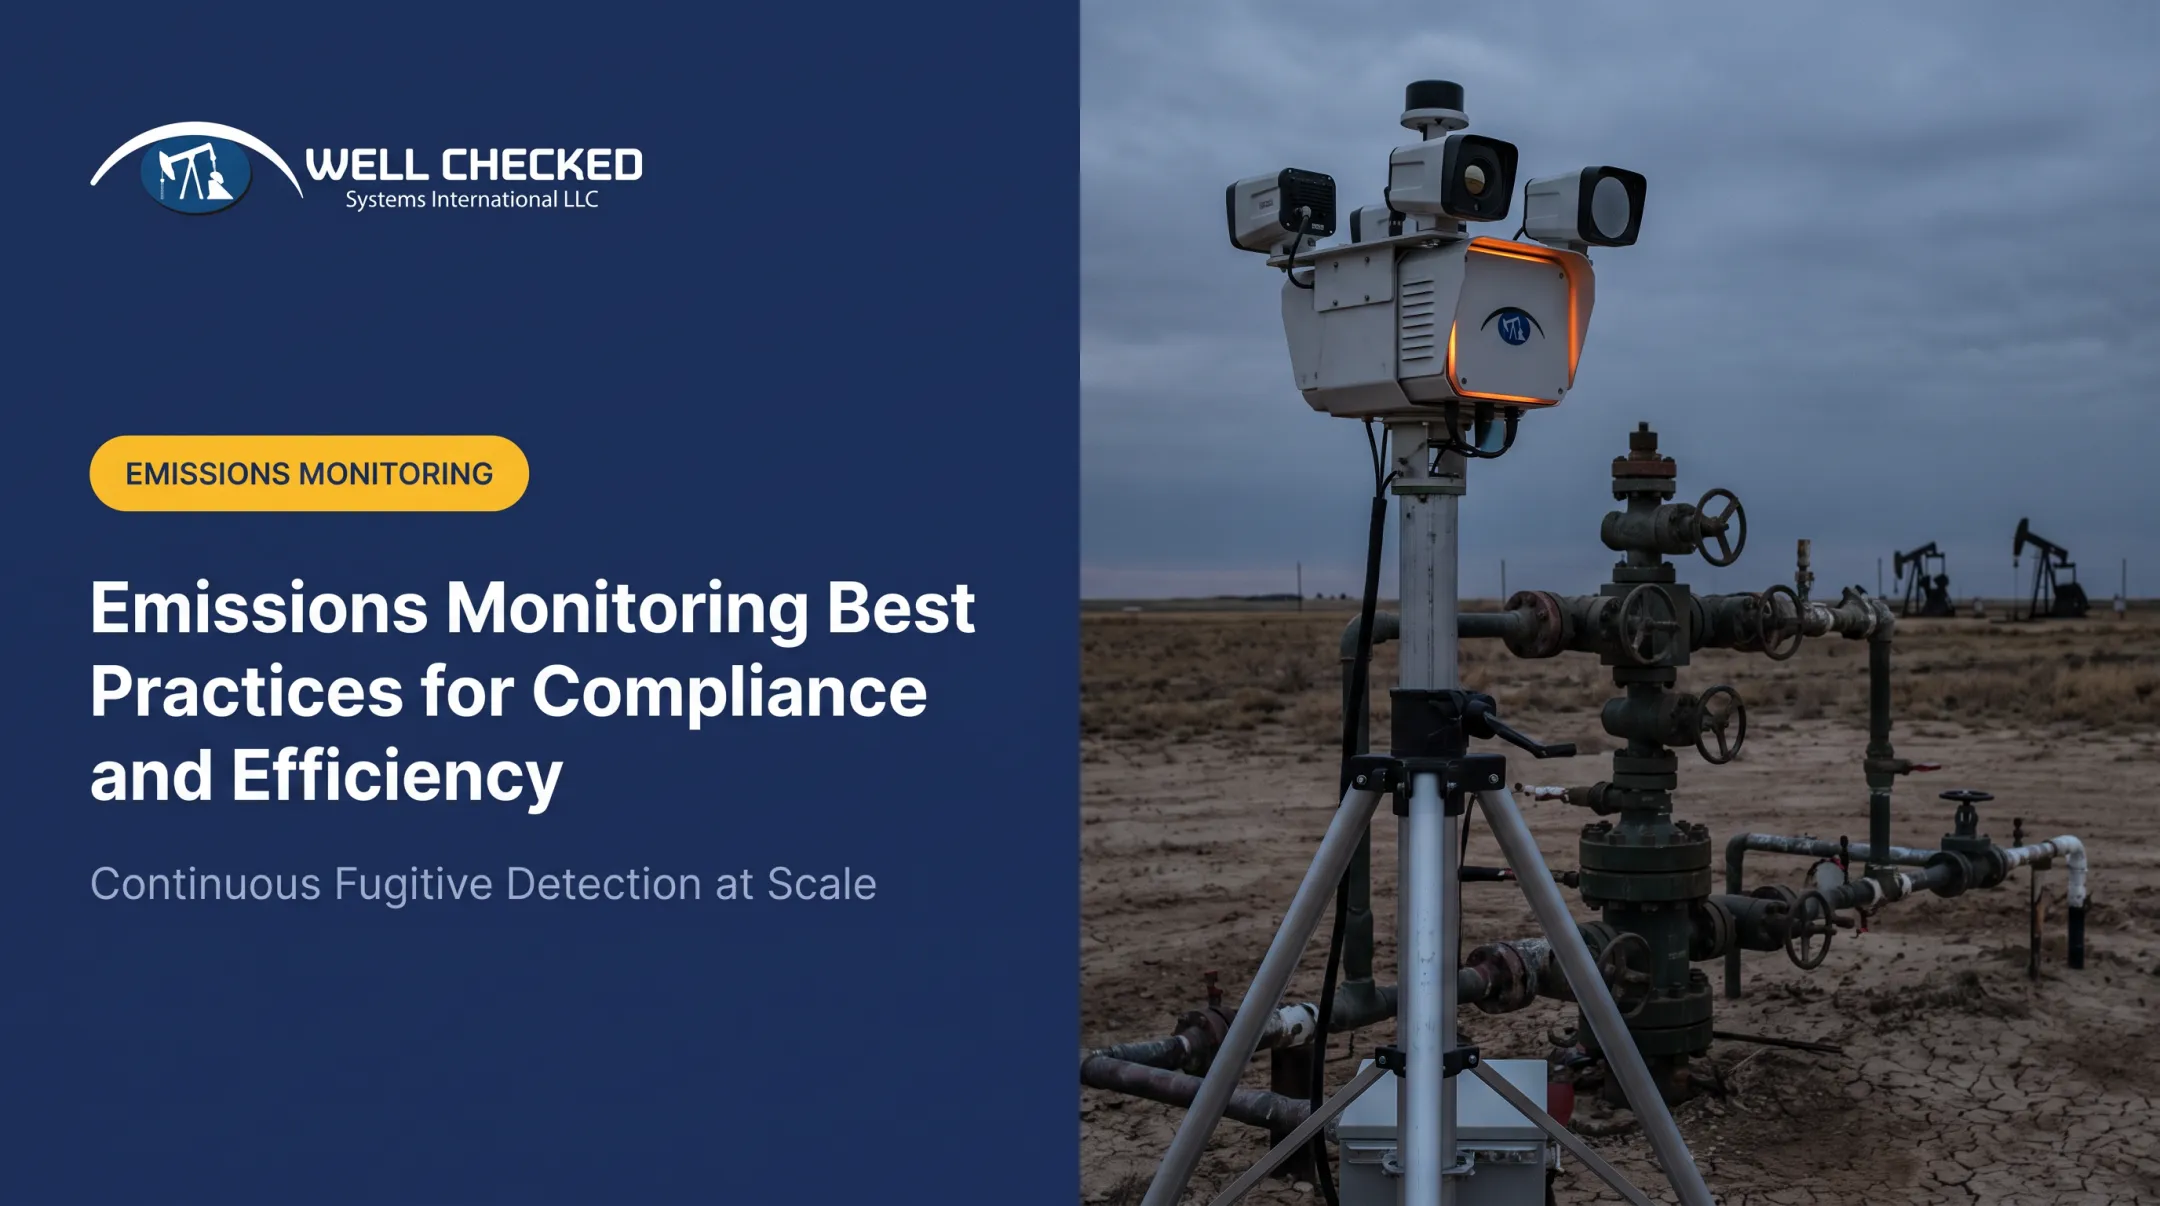
This is where cameras, LWIR optical gas imaging, acoustic sensors, and other monitoring inputs earn their keep. They identify unusual conditions around equipment and direct attention toward likely fugitive events instead of leaving field teams to guess.
AI and rules-based filtering play a specific role here: separating normal operating conditions and recurring background noise from anomalies that actually need human eyes on them. This isn't a substitute for regulatory verification. It's a way to make that verification faster and less noisy.
Well Checked's Zensory.ai™ platform illustrates this approach with multi-sensor monitoring across visual, acoustic, and gas-imaging inputs, learning a site's normal baseline over roughly two days before flagging deviations. That's one example of how the technology works, not a claim that any single product fits every regulatory program.
Continuous monitoring, where approved, has specific technical thresholds. EPA's alternative standards under OOOOb require continuous methods to detect at least 0.40 kg of methane per hour and produce valid emission-rate readings at least once per 12-hour block (EPA Methane ATM FAQ, 2026).
Any monitoring technology folded into a compliance program needs to match those specifics, not just detect "something."
Validate Events and Reduce False Positives
Detection generates a flag. Validation turns that flag into something defensible. This stage associates the alert with the correct equipment, compares sensor signals, checks operating context, confirms whether the condition is abnormal, and records the reviewer's decision.
Use clear event statuses so every flag has a defensible outcome:
- A suspected event — flagged, not yet reviewed
- A confirmed event — reviewed and validated as abnormal
- A normal operating condition — reviewed and dismissed
- An event requiring field investigation — validated and escalated
Well Checked's Zentinal Core™ service tier provides multi-sensor detection and false-alarm filtering at this step; quantification is a separate tier, Zentinal IQ™. But validation rules, human review, and applicable regulatory requirements still govern how that data gets used.
What needs to be preserved from this stage:
- Original alert and sensor source
- Timestamp and location
- Asset identity
- Review status and reason code
- User or system action taken
- Links to supporting files
EPA Method 21, for reference, sets its own bar for instrument reliability, requiring calibration precision within 10% of the calibration-gas value (EPA Method 21, 2017). Validation processes should mirror that level of rigor, even when the detection method differs from Method 21.
Quantify Emissions and Connect Findings to Action
A camera or alert identifies a potential release. It doesn't produce a defensible number by itself. Quantification assigns duration, estimated or measured volume, source category, uncertainty information, and the calculation method used to reach a reportable figure.
Detection and quantification are not the same step, and treating them as interchangeable is a common mistake. A defensible estimate requires an appropriate method, documented assumptions, and follow-up measurement where required.
The corrective-action workflow that follows typically looks like this:
- Acknowledge the validated event
- Assign an owner for response
- Dispatch field personnel or investigate remotely
- Document the repair or mitigation performed
- Verify resolution through a follow-up check
- Update the emissions record accordingly
Well Checked's Zentinal IQ™ is built specifically for this handoff, quantifying methane volume, duration, and rate only after Zentinal Core™ has validated an event. That sequencing (detect, validate, then quantify) is meant to prevent false-positive quantification from ever reaching a report. It's a useful example of the concept, though acceptance of any output still depends on the applicable regulator or reporting framework.

Preserve Records and Generate Compliance Outputs
An alert dashboard isn't a compliance record. The real value comes from the complete chain: source data, calculations, review decisions, work orders, repairs, approvals, and report versions, all linked and retrievable.
Relevant outputs for US upstream operators can include:
- EPA methane-rule alternative-monitoring submissions where applicable
- State-agency emissions inventories
- Internal HSE reviews
- OGMP 2.0 Level 4/5 reporting
- SASB or TCFD disclosures
OGMP 2.0's Level 5 standard, for context, reconciles source-level emissions estimates with independent site-level measurements taken at a representative sample of facilities (OGMP 2.0 Introduction, 2025). That's a distinct output from an OOOOb survey-and-repair record, and operators reporting to both need software that can structure data for each without duplicating effort.
Auditability features worth checking for:
- Role-based permissions
- Change history and calculation-version tracking
- Export controls
- Approval workflows
- Retention policies
- Drill-down from a reported value back to the original event
Before filing anything, run a quick readiness check:
- Is the data complete?
- Is the method appropriate for the requirement?
- Has a reviewer signed off?
- Is corrective action closed out?
- Is evidence retained?
- Does the report reconcile with the underlying events?
Verify current rule language, deadlines, and applicability thresholds directly. Software supports this process but doesn't replace regulatory judgment.
Where Is Emissions Monitoring Management Software Used?
Upstream operators deploy this software across producing wells, tank batteries, compressors, separators, pneumatic devices, flares, and other remote assets. Routine site visits and periodic LDAR records often can't provide continuous context at these locations.
Different teams pull different value from the same underlying data:
- Operations gets prioritized alerts instead of a flood of raw notifications
- Field personnel receive assigned response tasks with clear next steps
- HSE and environmental teams review evidence and prepare reporting
- Sustainability teams reuse governed data for OGMP 2.0 or ESG disclosures
Multi-basin operators tend to standardize event classification, asset records, and response procedures across their portfolio while adapting monitoring methods and regulatory outputs to each state and facility type. What works for a Permian tank battery might need adjustment for a San Juan Basin gas well.
Well Checked operates continuous monitoring programs across remote oil and gas sites in multiple US basins. That is operating context rather than a guarantee of compliance outcomes for every operator or jurisdiction; requirements still vary by state and asset type.

The software tends to earn its keep fastest where operators face:
- Remote, hard-to-reach assets that drive frequent, costly field travel
- Multi-site or multi-basin operations
- High volumes of alerts to sort through
- Disconnected systems that don't talk to each other
- Multiple overlapping reporting frameworks
- A push to move from routine visits toward operating by exception
Conclusion
Compliance is a chain: detect, validate, quantify, respond, document, report. Emissions monitoring management software supports compliance by keeping that chain connected and traceable, rather than scattered across spreadsheets, inboxes, and inspection binders.
When evaluating a platform, look past the dashboard. Prioritize:
- Sensor compatibility with your field equipment
- False-alert handling before operators are notified
- Quantification methods and audit-trail depth
- Offline or edge capability at remote sites
- Clear ownership of each workflow step
- Outputs that match EPA, state, OGMP 2.0, and ESG requirements The right fit depends on your specific exposure, not a generic feature list.
Frequently Asked Questions
What is the best compliance software?
It depends on your applicable regulations, asset types, monitoring methods, and reporting frameworks. Compare complete event-to-report workflows rather than judging platforms on dashboards alone.
What is emissions monitoring management software?
Emissions monitoring management software handles detection, data collection, validation, quantification, response tracking, recordkeeping, and compliance reporting. Each stage stays linked so events flow into defensible records.
How does emissions monitoring software support EPA compliance?
It organizes monitoring data, event reviews, corrective actions, calculations, and audit trails into submission-ready formats. Applicability, approved methods, and final compliance responsibility remain with the operator.
What is the difference between emissions monitoring software and carbon accounting software?
Emissions monitoring works at the asset and event level: detection, response, and quantification. Carbon accounting handles corporate Scope 1, 2, and 3 inventories. Some operators need both, connected.
Can emissions monitoring software detect and quantify methane leaks?
Detection and quantification depend on the sensors, methods, operating conditions, and validation process in use. Software connects these stages, but it can't make every detection automatically reportable.
What features should oil and gas operators look for in compliance software?
Prioritize multi-sensor integration, asset context, false-alert filtering, event workflows, quantification methods, and audit trails. Confirm offline capability, role-based approvals, and support for your EPA, state, OGMP 2.0, and ESG requirements.