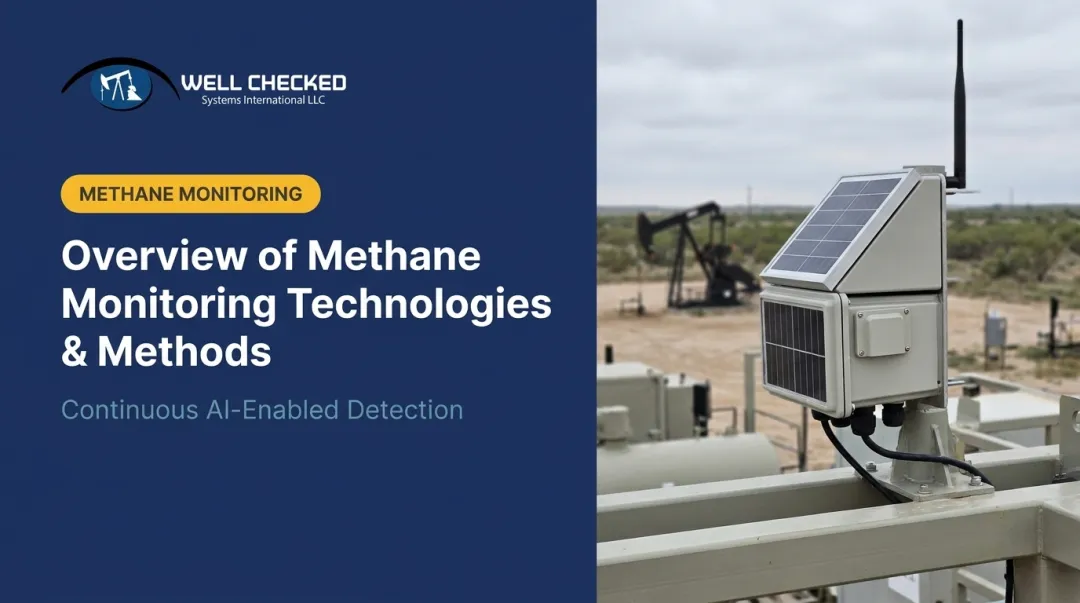
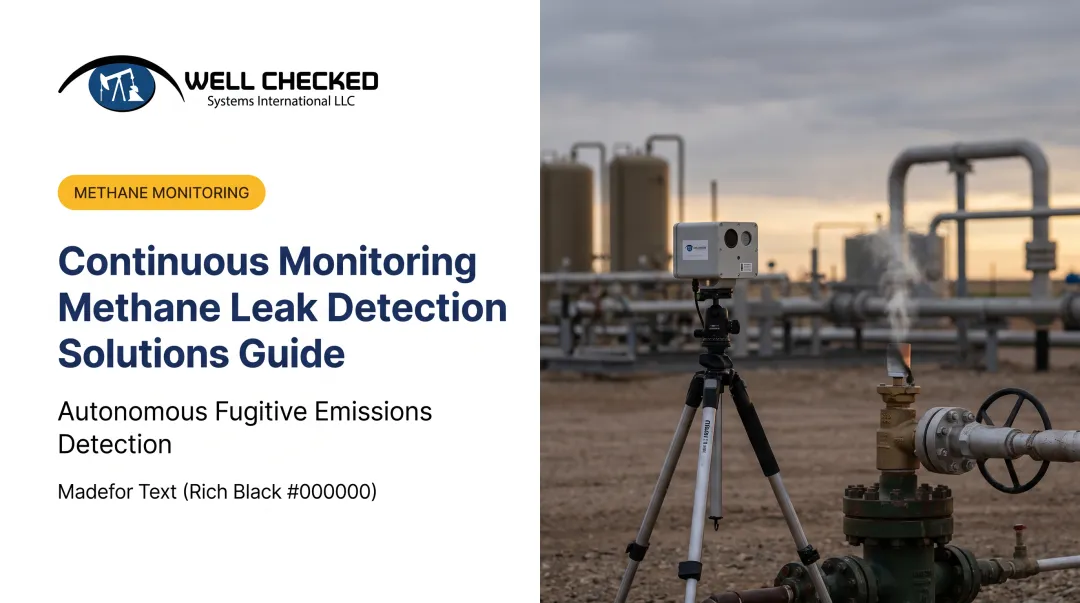
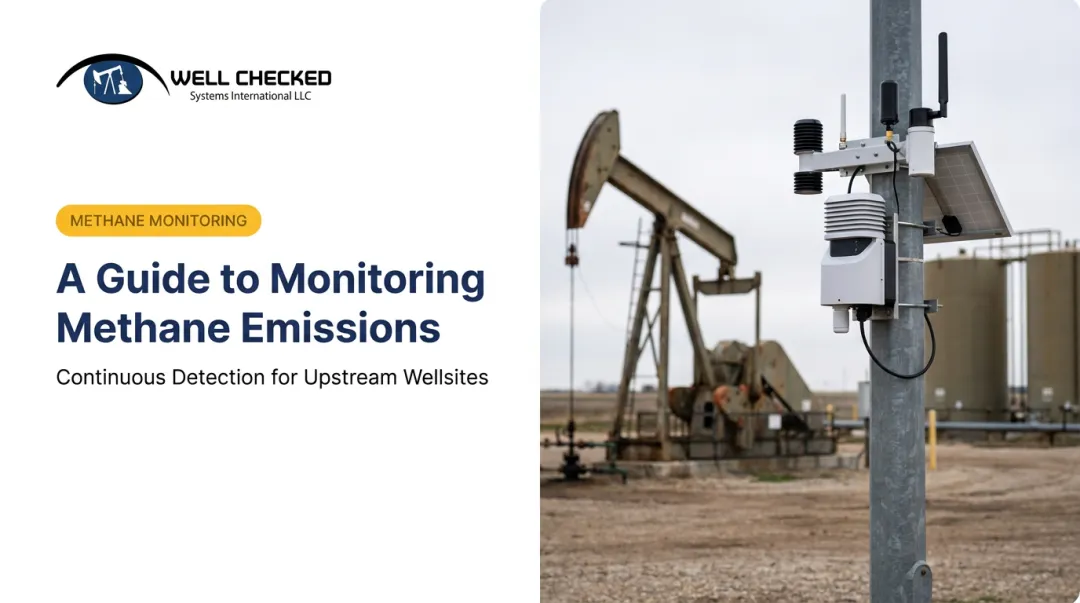
That's the real problem. Traditional pumper routes and quarterly optical gas imaging (OGI) or leak detection and repair (LDAR) surveys only capture a snapshot. A leak that starts the day after an inspection can run undetected for weeks or months before anyone notices.
Continuous monitoring is becoming the new baseline for detection, compliance, and cost control. This guide breaks down how it works, why operators are switching, and what to look for when evaluating a system.
Key Takeaways
- Continuous monitoring closes the gap periodic surveys miss, cutting response time from months to hours.
- OGMP 2.0's top tiers require measured data; periodic inspections generally can't clear that bar.
- Vendor accuracy varies widely in controlled-release tests, making false-alarm filtering essential.
- Route-based visits cost operators $1M–$5M+ annually; continuous monitoring shifts that spend to exception-based response.
What Is Continuous Methane Monitoring?
Continuous methane monitoring is an automated, 24/7 detection system — built from sensors, cameras, or spectrometers plus a data-processing layer — that identifies and quantifies emissions in near real time. Instead of checking a site once a quarter, it watches constantly and flags problems as they happen.
Two distinct monitoring layers exist, and the difference matters:
Site-level monitoring gives facility-wide awareness of unknown or fugitive sources, designed to catch the leak nobody expected. Source-level systems (sometimes loosely called CEMS) attach to known vents, flares, or specific equipment to track emissions from a source that's already identified.
Research on facility-scale systems draws this line clearly: one measures the whole site's ambient signature, the other measures a specific point. Most operators eventually need both.
Core Components of a Continuous Monitoring System
A working system generally stacks four layers together:
- Sensing hardware — cameras, gas sensors, or open-path lasers positioned to see the equipment that matters most.
- Meteorological data — wind speed and direction inputs, used by many facility-wide systems to help localize where a plume originated.
- An analytics/AI layer — the logic that separates routine activity (a pump cycle, a vent event) from a genuine anomaly.
- Alerting and reporting workflow — how a validated event actually reaches a human who can act on it.

Well Checked Systems' Zensory.ai™ platform illustrates this stack in practice. It fuses three sensing modalities — high-resolution video, Long-Wave Infrared optical gas imaging, and acoustic equipment sensors — into one edge-computing unit at each wellsite.
The Zentinal Core™ layer runs a roughly two-day AI site-learning cycle to establish what "normal" looks like before it starts alerting. Validated events then route to a dashboard, email, SMS, and SCADA simultaneously.
Continuous Monitoring vs. Periodic Surveys: Why the Method Matters
Periodic surveys (handheld detectors, OGI camera walks, drone flyovers) remain common because they're familiar and relatively cheap per visit. Their limitation is structural: each survey only reflects conditions at that exact moment. Wind, camera distance, and even the surveyor's experience all affect what gets caught during that window, and nothing gets checked again until the next scheduled visit.
Here's how the two approaches stack up:
| Factor | Periodic Surveys | Continuous Monitoring |
|---|---|---|
| Detection frequency | 2–4 times per year | 24/7, near real time |
| Leak-duration capture | Unknown between visits | Tracked from onset to repair |
| Regulatory tier supported | OGMP Level 1–3 (estimated) | OGMP Level 4/5 (measured) |
| Labor burden | High — recurring site visits | Low — exception-based response |
| Cost profile over time | Recurring, scales with site count | Upfront investment, lower marginal cost |
Repair Timing Is What Actually Drives Total Emissions
The part that often gets missed is this: total methane released depends less on whether a leak is eventually found and more on how long it stays unrepaired.
A leak caught on day one and fixed within 24 hours releases a fraction of what the same leak would release if it runs for six weeks before the next quarterly survey catches it.
Continuous monitoring compresses that detect-to-repair window from weeks or months down to hours or days. That compression, not the sensor's raw detection range, is what actually moves the emissions-reduction needle.
OGMP 2.0 Reporting Tiers and Monitoring Method
That same urgency shapes how regulators grade monitoring quality. Periodic surveys typically top out at OGMP Level 3, where operators report detailed source types using generic emission factors instead of measured data. Reaching Level 4 or 5 "Gold Standard" status requires source-specific or independently reconciled measurement data, which is exactly what continuous, measurement-based monitoring provides.
When to Use Each Approach
Meeting that higher measurement bar doesn't mean periodic surveys disappear entirely — neither method fully replaces the other:
- Periodic surveys still make sense for low-risk equipment or as a wide-area screening supplement.
- Continuous monitoring is warranted on high-emission-risk equipment (tanks, compressors, wellheads), especially for operators facing regulatory scrutiny or investor pressure.
Well Checked Systems' Zentinal Core™ platform is built for that second category, running continuous multi-sensor detection across Appalachian Basin monitoring.

Regulatory and Business Drivers Behind Continuous Monitoring
Compliance and cost pressure are pushing operators toward continuous systems from multiple directions at once.
The Regulatory and ESG Landscape
The EPA's methane rule (40 CFR Part 60 Subpart OOOOb) sets standards for new and modified sources, and it recognizes alternative-monitoring compliance pathways for approved continuous technologies. That's a meaningful shift away from mandating periodic inspection as the only path to compliance.
Investor-facing frameworks are pushing in the same direction:
- OGMP 2.0: Level 4/5 requires measurement-based reporting, reconciled against independent site-level data.
- SASB Oil & Gas E&P: requires quantified methane, flaring, and fugitive emissions disclosures.
- TCFD: requires disclosure of Scope 1 emissions and related risk management.
Publicly traded E&Ps increasingly need audit-ready, continuous data rather than modeled inventories to satisfy these frameworks.
The Cost Case and Response Model
Route-based site visits are expensive at scale. Mid-to-large operators commonly spend $1 million to $5 million or more annually on routine pumper-route inspections. Continuous monitoring lets operators shift from routine visits to operate by exception, sending crews only when a validated event demands it.
That shift depends on a fast response loop. Well Checked's architecture follows an acknowledge-dispatch-mitigate model: Zentinal Core™ validates the event and fires an alert, then the dispatch team mobilizes using pre-built runbooks. The crew mitigates the issue within 24 hours total.
That window is specifically designed to support a documented, timely response to a validated methane event.
Fewer routine site visits also means:
- Less pumper-route mileage, reducing exposure to traffic, weather, and hazardous site conditions.
- Lower fuel and mileage costs across the field fleet itself.
- More field-crew hours available for high-value maintenance instead of routine drive-bys.
The market is moving this direction at scale. A major integrated operator has publicly stated it expects to deploy continuous monitoring at all its key operated sites in the Permian Basin by the end of 2026. That timeline is a clear signal: basin-wide continuous detection is becoming standard practice, not a pilot experiment.
Core Technologies Powering Continuous Methane Monitoring
Several distinct technologies fall under the "continuous monitoring" umbrella, each with different strengths.
Open-Path Laser and Spectrometer Systems
Multi-open-path laser dispersion spectrometers measure path-averaged methane concentrations across a facility, then combine that with wind data and statistical inference to localize and quantify emissions. Long-term deployments have shown these systems can run unattended for months at a time and catch persistent sources nobody knew existed.
They also have known limits. Localization accuracy degrades with limited wind-vector diversity, and quantification can be off by a wide margin near obstacles or in low-wind conditions.
IoT Point Sensor Networks
Distributed, low-cost fixed-point sensors (often semiconductor or metal-oxide gas detectors) get placed close to likely emission sources like valves, seals, and tank hatches. They're cheaper per unit than open-path systems, which makes dense placement across a site more affordable, but each sensor only "sees" its immediate vicinity.
Optical/Infrared Gas Imaging (OGI) Cameras
OGI cameras split into two camps:
| Attribute | Cooled MWIR | Uncooled LWIR |
|---|---|---|
| Sensitivity to faint leaks | Higher | Lower |
| Spectral specificity | Lower | Higher |
| Day/night operation | Yes | Yes |
| Relative cost | Higher (historically ~$100,000+) | Roughly one-third the cost |
Long-Wave Infrared cameras enable day-and-night methane and volatile organic compound (VOC) detection at a fraction of traditional mid-wave IR pricing, a big reason LWIR has become the practical choice for continuous, multi-site deployments rather than occasional handheld surveys. Well Checked has a USPTO provisional patent filing for Detecting and Quantifying Fugitive Methane and Vapor Emissions Using Infrared Imaging and Machine Learning.
Multi-Sensor AI Monitoring Platforms
The newest category combines multiple sensing modalities (video with AI object detection, acoustic anomaly detection, and OGI) into a single system.
Zensory.ai™ is built this way: it fuses sight, sound, and gas detection, then runs a roughly two-day AI site-learning cycle at each new location to teach itself what normal process activity looks like before it starts alerting on anything.
This site-specific learning pays off directly in the field. At production scale, the platform analyzes 1,500+ videos per site per day using onsite edge computing, meaning detection and analysis keep running even when a remote wellsite loses network connectivity, with data syncing automatically once the connection returns.
Accuracy Challenges: What the Data Really Shows
Raw detection range gets a lot of marketing attention. Discernment, telling real leaks apart from normal noise, matters more, and the independent data backs that up.
A 2023 single-blind controlled-release study evaluating 11 commercial continuous monitoring systems found true-positive rates ranging from 0.3% to 87.7% and false-positive rates ranging from 0% to 79% across vendors. Quantification varied just as widely: at low release rates, mean error spanned from -44% to +586% depending on the system tested.
Why the swing? Simple concentration-threshold alarms fail in the field because atmospheric conditions get in the way:
- Temperature inversions trap diffuse methane near the ground overnight, spiking readings with no new leak involved.
- Variable wind direction makes source attribution unreliable; one field trial found weak wind-direction diversity increased source misattribution by roughly 6.66 times.
- Equipment venting and maintenance activity can produce short-term concentration spikes that mimic fugitive emissions, especially without site-specific baselining.
This is exactly why filtering normal operational variability from genuine fugitive emissions has become as important a selection criterion as raw sensitivity. It's the design philosophy behind operate-by-exception systems: an alert is only useful if the crew can trust it's real.

Best Practices for Implementing a Continuous Monitoring Program
A few practices consistently separate programs that work from ones that generate alert fatigue and get ignored:
- Run a site-specific baseline period before go-live. Generic threshold alarms can't account for a site's unique venting schedules, pump cycles, and seasonal patterns — a learning period can.
- Pair continuous monitoring with periodic verification methods. Retain periodic OGI or drone surveys for wide-area verification and for equipment that isn't instrumented yet.
- Feed outputs directly into reporting workflows. Route data straight into EPA submissions, OGMP inventories, and SASB/TCFD disclosures rather than reconciling spreadsheets by hand after the fact.
Frequently Asked Questions
What is the difference between continuous methane monitoring and LDAR surveys?
LDAR and other periodic surveys capture a point-in-time snapshot, checked a few times a year. Continuous monitoring runs 24/7, capturing full leak duration and enabling much faster repair response.
How does continuous methane monitoring support OGMP 2.0 Level 4/5 compliance?
OGMP 2.0's higher tiers require measured, not estimated, emissions data. Continuous, source- or site-level monitoring provides that measurement basis; periodic surveys generally don't.
What technologies are used in continuous methane monitoring systems?
Common technologies include open-path laser spectrometers, IoT point sensor networks, OGI/infrared cameras, and multi-sensor AI platforms that combine video, acoustic, and gas detection into one system. Well Checked has a USPTO provisional patent filing covering its acoustic anomaly detection technology.
How accurate are continuous methane monitoring systems?
Accuracy varies by vendor and technology. Independent controlled-release studies have found meaningful gaps in both quantification accuracy and false-positive rates across commercial systems.
Does the EPA require continuous methane monitoring?
The EPA methane rule (40 CFR Part 60 Subpart OOOOb) recognizes alternative continuous-monitoring compliance pathways for approved technologies and methods. It's not a blanket universal mandate.
How much does it cost to implement continuous methane monitoring?
Upfront costs vary by site count and technology chosen. Ongoing costs are typically far lower than route-based site-visit programs, which can run into the millions annually for mid-to-large operators.