Fugitive methane leaks happen at wellsites, along pipelines, and inside processing equipment across the entire supply chain. These leaks drain revenue that never reaches the sales meter and create reportable events under EPA's methane rule.
This article covers what causes methane leakage, where it originates, how it's measured, and why modern detection technology is reshaping how operators manage compliance.
Key Takeaways
- Methane leakage is unintentional fugitive gas release from wells, valves, tanks, and pipelines—not venting or flaring.
- Independent field measurements often find leak rates several times higher than official inventories.
- EPA Subpart OOOOb and OGMP 2.0 push operators toward continuous, measurement-based monitoring.
- AI continuous monitoring, like Well Checked's Zensory.ai™, flags fugitive events far faster than quarterly checks.
What Is Methane Leakage?
Methane leakage refers to the unintentional fugitive release of methane gas from oil and gas infrastructure — wellheads, compressors, valves, connectors, storage tank hatches, and pipelines. It's distinct from venting or flaring, which are deliberate releases or combustion events built into normal operations.
Raw and pipeline-quality natural gas is roughly 80% to 98% methane, depending on the source and processing stage. Nearly any unburned gas that escapes equipment is a methane leak.
Why Methane Loss Matters
Methane is the principal component of natural gas, so leaked volume is saleable product that never reaches the meter. Capturing it recovers revenue and reduces the reportable emissions an operator must account for.
Leakage vs. venting vs. flaring:
- Leakage — accidental escape through faulty or degraded equipment
- Venting — intentional, uncombusted release for operational reasons
- Flaring — intentional combustion of excess gas
Not every leak is equal. A high-impact subset is the "super-emitter" event — the EPA defines these as remotely detected releases at or near a facility at 100 kg per hour or greater. One malfunctioning component can outweigh dozens of small, routine leaks combined.
A 2018 Science study estimated the US oil and gas supply chain leaked 13 million metric tons of methane (based on 2015 data) — about 60% higher than the official EPA inventory estimate at the time.

Where Do Methane Leaks Come From?
Common Leak Sources at Wellsites
Fugitive emissions typically originate from a small set of repeat offenders:
- Valves and connectors with worn seals or loose fittings
- Compressor seals and packing, especially under vibration
- Pneumatic controllers that bleed gas by design and often malfunction
- Storage tank thief hatches left improperly seated
- Corroded fittings and degraded gaskets
The EPA identifies loose connections, damaged valve stems, corrosion, and general wear as leading failure mechanisms. None of these require a catastrophic failure. Time, vibration, and pressure cycling do that work on their own.

Leaks Across the Supply Chain
Leak points exist at every stage: production wellheads, gathering lines, processing plants, transmission pipelines, and local distribution networks. Each handoff point introduces new connectors, new equipment, and new opportunities for escape.
Remote, unmanned wellsites face a particular vulnerability here. When a site only gets a human visit once a week or once a month, a leak can run undetected for the entire interval between visits. That gap is exactly what continuous monitoring is designed to close.
Why Methane Leakage Matters: Climate, Health, and Financial Impact
Because methane is the product itself, mitigation often pays for itself: captured gas can be sold rather than vented. That is why many operators treat leak reduction as a product-recovery program rather than a cost centre.
Those same leaks also affect local air quality. Escaped gas often carries volatile organic compounds such as benzene and ethylbenzene, which the EPA links to ground-level ozone. A peer-reviewed Environmental Science & Technology study found the largest modeled health impacts from oil and gas emissions in Colorado, Pennsylvania, Texas, and West Virginia.
Operators face a cost side as well. Under the Inflation Reduction Act's Waste Emissions Charge framework, statutory rates were set at:
- $900 per metric ton for 2024
- $1,200 per metric ton for 2025
- $1,500 per metric ton for 2026 and beyond
Congress disapproved that particular rule under the Congressional Review Act in March 2025. Excess or unreported methane loss still carries a rising price through EPA enforcement and ESG-driven investor pressure.
How Is Methane Leakage Detected and Measured?
Traditional Methods Fall Short
For decades, leak detection meant handheld optical gas imaging (OGI) cameras and ground crews walking routes on a quarterly schedule. These inspections are essentially snapshots. A leak that starts the day after an inspection can run undetected for weeks or months.
Intermittent emissions are especially easy to miss. A leak that starts and stops between survey windows often never appears in the inspection record, no matter how frequently routes are walked.
Remote Sensing Fills Some Gaps
Satellites and aerial surveys have improved wide-area detection considerably. Platforms like GHGSat's DATA.SAT deliver facility-level attribution within 24 hours at roughly 100 kg/hour (118 mcf/d) detection thresholds, while airborne systems can detect down to 3.5 kg/hour. These tools are excellent for basin-wide screening, but they're not built for continuous, site-level monitoring of every valve and connector.
Continuous Multi-Sensor Monitoring Is the Emerging Standard
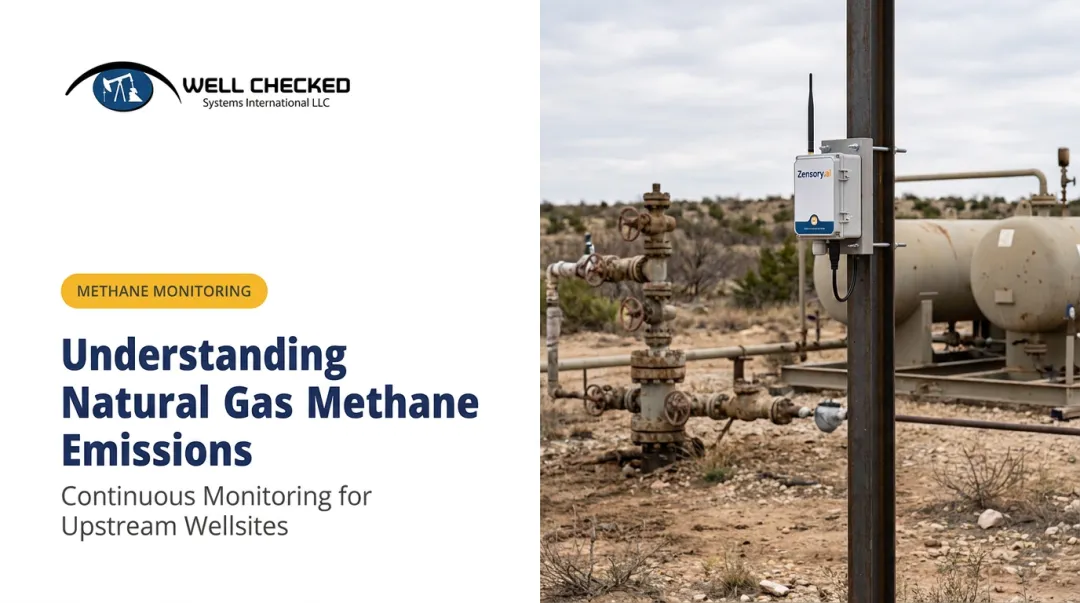
Closing that gap takes continuous monitoring at the wellsite itself. Well Checked's Zensory.ai™ platform combines three sensor types at each site:
- High-resolution video for 360° visual site coverage and object detection
- Acoustic AI that identifies abnormal equipment sounds
- Long-Wave Infrared Optical Gas Imaging for continuous methane and VOC detection
Through an AI Site Learning cycle lasting roughly two days per site, the Zentinal Core™ layer builds a baseline of normal operations for that location: routine venting, pneumatic controller cycling, and standard equipment noise.
Once that baseline exists, the system flags true fugitive anomalies instead of flooding operators with false alarms. Validated events move into an acknowledge-dispatch-mitigate workflow:
- Dispatch teams get near-real-time alerts on confirmed methane events
- Response can begin inside a documented 24-hour window
- Teams no longer wait for the next quarterly inspection cycle
Zentinal IQ™ then quantifies emissions volume, duration, and rate. The output is regulatory-defensible data formatted for EPA and state-agency submissions, which is what compliance audits and ESG disclosure requests actually require.

Regulatory Landscape for Methane Leakage in the US
The regulatory environment now centers on measurement-based accountability.
EPA's 40 CFR Part 60 Subpart OOOOb sets standards for new, modified, or reconstructed sources, with fugitive-monitoring requirements at wellsites, compressor stations, and central production facilities.
The rule allows alternative monitoring pathways: operators can use continuous systems instead of standard quarterly OGI surveys when the method meets EPA performance criteria for detection sensitivity and uptime.
OGMP 2.0 has become an informal industry benchmark even outside strict legal requirements. Its Level 4 and Level 5 reporting tiers push operators toward source-level, measurement-based inventories rather than generic emission-factor estimates. Level 5 goes further, reconciling those source-level measurements against independent site-level data.
Additional pressure comes from ESG disclosure frameworks:
- SASB's Oil & Gas E&P standard requires disclosure of gross Scope 1 emissions and the percentage attributable to methane
- TCFD frameworks require climate-risk metrics and targets tied to emissions performance
- For publicly traded E&Ps, methane metrics are now baseline expectations from investors and analysts
These frameworks shape how operators document emissions performance for capital markets and compliance teams alike.

How Operators Can Reduce Methane Leakage
Reducing fugitive emissions comes down to three practical shifts:
- Maintain high-risk equipment on a regular schedule: pneumatic controllers, compressor seals, and valve packing degrade predictably. Scheduled maintenance catches wear before it becomes a leak.
- Move from periodic LDAR to continuous monitoring: quarterly inspections leave gaps measured in weeks. Continuous systems close that gap to hours.
- Operate by exception: instead of sending crews on fixed operator routes regardless of conditions, dispatch personnel only when an autonomous system flags a validated anomaly.
That last point carries real financial weight. Route-based site visits can cost mid-sized to large operators $1 million to $5 million or more annually, according to Well Checked's internal data.
Beyond direct labor and vehicle cost, unnecessary field travel exposes crews to traffic incidents, extreme weather, and hazardous site conditions. Those risks do not apply when cameras, acoustic sensors, and infrared imaging watch the site continuously instead of a truck on a schedule.
Well Checked's platform is deployed across remote US onshore sites, including a continuous monitoring program in the Appalachian Basin, to support this exception-based operating model.
Frequently Asked Questions
What is the biggest source of methane?
Globally, agriculture (livestock and rice cultivation) is the largest human-caused source, contributing around 40%. Oil and gas extraction, processing, and distribution follow closely, accounting for roughly 23% of anthropogenic methane emissions.
How is methane leakage different from venting or flaring?
Leakage is the accidental escape of gas through faulty or degraded equipment. Venting and flaring are intentional: venting releases uncombusted gas on purpose, while flaring burns it off deliberately.
Can methane leaks be repaired quickly once detected?
Yes, in most cases. Leaks from valves, connectors, and tank hatches are usually simple, fast fixes once a crew knows the exact location. Detection speed, not repair speed, is typically the real bottleneck.
How much methane leaks from the US oil and gas industry each year?
Independent research (Alvarez et al., 2018) estimated roughly 13 million metric tons annually, about 60% higher than the EPA's official inventory estimate for the same period. Newer aerial surveys have found gaps of similar or larger magnitude.
Why do methane leaks matter more than the volume suggests?
Methane is the principal component of natural gas, so leaked volume is saleable product lost before the meter. Leaks also trigger reporting and repair obligations under EPA's methane rule, so a small release can carry costs well beyond the gas itself.
What technology is used to detect methane leaks at oil and gas sites?
Options range from handheld OGI cameras and satellite surveys to continuous multi-sensor AI platforms combining video, acoustic sensing, and infrared optical gas imaging, like Well Checked's Zensory.ai™ system.