Companies in the top quartile of "real-time-ness" saw 62% higher revenue growth and 97% higher profit margins than bottom-quartile peers, according to MIT Center for Information Systems Research's 2024 study of 259 global companies. The gap between organizations that see problems as they happen and those that find out later keeps widening.
The core issue is simple: delayed detection is expensive. A pump failure that goes unnoticed for a week, a network outage discovered an hour too late, a methane leak that runs undetected between quarterly inspections — each represents cost, risk, or regulatory exposure that continuous oversight could have caught immediately.
This guide covers what real-time monitoring systems actually are, how they work, the main types in use today, and how the concept plays out in demanding industrial settings like upstream oil and gas wellsites.
Key Takeaways
- Real-time monitoring analyzes data continuously with near-zero latency, letting teams detect and respond to events instantly
- Five domains depend on it: IT infrastructure, industrial equipment, security, emissions monitoring, and business operations
- A typical system has five layers: sensors, transmission, processing, alerting, and visualization
- In oil and gas, multi-sensor monitoring replaces costly manual site visits with continuous, defensible data records
What Is a Real-Time Monitoring System?
A real-time monitoring system continuously collects, transmits, and analyzes data as events occur, then triggers a response within seconds or minutes rather than hours or days.
This differs sharply from batch or periodic monitoring, where data is reviewed only at scheduled intervals. The National Institute of Standards and Technology (NIST) makes an important clarification here: "continuous" monitoring doesn't mean literally nonstop collection — it means collection frequency set high enough to support risk-based decisions.
The practical distinction that matters is latency: how much time passes between an event occurring and someone finding out about it.
Core Components of a Real-Time Monitoring System
Every real-time monitoring setup, regardless of industry, shares the same basic architecture:
- Sensor/agent layer: captures raw data at the source: temperature readings, video frames, gas concentrations, acoustic signatures, network packets, or transaction records
- Data transmission and ingestion layer: moves data from field devices to a central processing system, using edge computing locally in remote or connectivity-limited environments
- Analysis/processing layer: filters signal from noise, increasingly using AI and machine learning to distinguish genuine anomalies from normal operational variation
- Alerting and notification layer: pushes actionable signals to the right team within a defined time window, through dashboards, SMS, email, or system integrations
- Visualization/dashboard layer: presents both live and historical data so decision-makers can see trends, not just isolated alerts

Each layer depends on the one before it. A great sensor feeding a slow network is still a slow system.
Why Speed and Accuracy Both Matter
Speed without accuracy just produces noise faster. A monitoring system only earns its keep if it catches real problems quickly while filtering out the alerts that don't require action.
The cost of getting this wrong is steep. ITIC's 2024 survey of more than 1,000 organizations found that over 90% of midsize and large enterprises now report that one hour of downtime exceeds $300,000. Another 41% put the cost between $1 million and more than $5 million per hour.
At the same time, too many low-value alerts create their own problem. Google's Site Reliability Engineering guidance is blunt on this point: a page should be urgent, actionable, and require human judgment. Anything less just trains people to ignore alerts, undermining the entire monitoring investment.
What Are the Types of Real-Time Monitoring?
Real-time monitoring spans several distinct domains, each with its own sensors, tools, and objectives, from IT infrastructure to industrial equipment to financial markets.
IT & Network Infrastructure Monitoring
This type tracks CPU usage, memory, network traffic, and application uptime to keep systems available. The IETF's network telemetry framework formalizes how this data is generated, collected, and used for automated management across large networks.
Industrial & IoT Equipment Monitoring
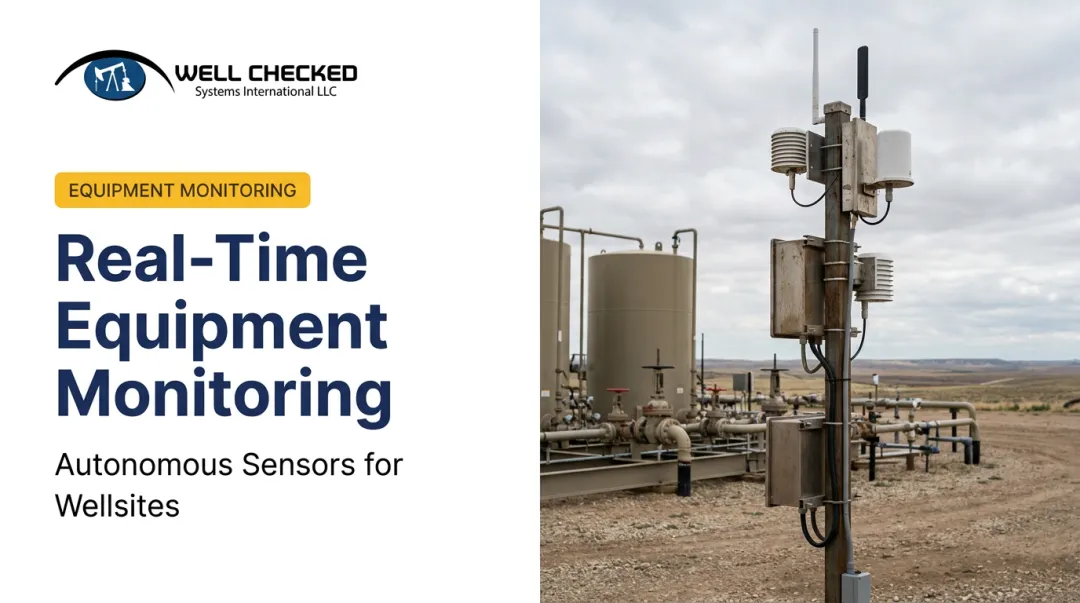
Connected sensors on machinery, pipelines, or remote assets track vibration, temperature, and operational status. This is the foundation of condition-based maintenance — using live data instead of a fixed schedule to decide when equipment needs attention.
Environmental & Emissions Monitoring
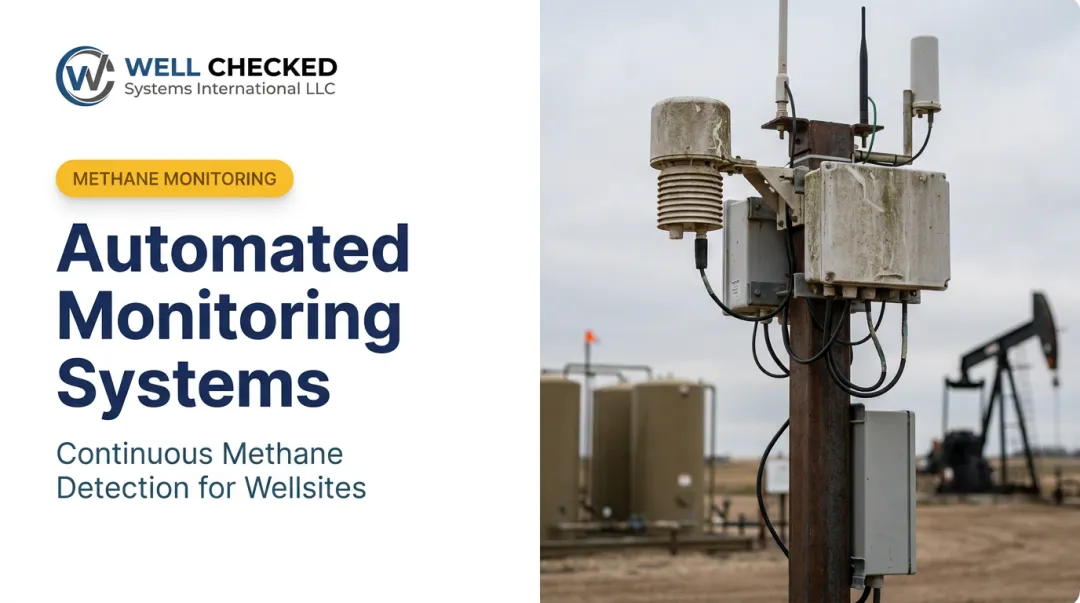
This category continuously tracks air quality, methane and volatile organic compound (VOC) concentrations, or other environmental indicators, often to satisfy regulatory requirements in industries like oil and gas. Instead of a snapshot every few months, sensors report conditions around the clock. In upstream oil and gas operations, this shift from quarterly inspections to continuous detection is what makes EPA and OGMP 2.0 compliance reporting defensible.
Security & Surveillance Monitoring
Video, access control, and network security tools work together to detect intrusions or abnormal behavior as it happens, rather than during a post-incident review.
Application & Digital Experience Monitoring
This tracks software performance, response times, and end-user experience so issues get caught before customers notice them. Gartner frames this as measuring the full quality of a user's application experience, not just backend server health.
Business & Financial Real-Time Monitoring
Live transaction data, sales figures, or market feeds support immediate operational or trading decisions. Payment-fraud monitoring is a good example: the Bank for International Settlements projects global fraud losses in cross-border payments to climb from roughly $4.4 billion in 2023 to over $7.6 billion by 2028. This trajectory is exactly why real-time transaction screening has become standard practice.

Key Benefits of Implementing Real-Time Monitoring
Faster detection, faster resolution: When teams see a problem the moment it starts, mean time to detect and mean time to resolve both drop — and given that downtime can cost $300,000 or more per hour, that speed translates directly to money saved. That logic extends to the people doing the watching.
Continuous monitoring, lower labor costs: Manual, route-based, or scheduled inspections are expensive to staff and only capture a moment in time. Replacing them with always-on sensor data means fewer unnecessary site visits and more targeted maintenance.
- NIST's analysis of U.S. manufacturers found that establishments in the top half of predictive-maintenance adoption had 15% less downtime and an 87% lower defect rate than those relying least on it
- The same analysis pegged the upside at $6.5 billion in annual benefit available to U.S. discrete manufacturers expanding predictive-maintenance adoption
Continuous data, stronger compliance: Auditors and regulators increasingly favor ongoing, timestamped records over periodic snapshots that leave gaps. A continuous record shows not just that a problem was eventually caught, but exactly when it started and how quickly someone responded, giving upstream operators the documentation they need for EPA methane rule and OGMP 2.0 reporting.
Real-Time Monitoring in Industrial and Oil & Gas Operations
Upstream oil and gas has traditionally relied on pumper routes and quarterly Leak Detection and Repair (LDAR) inspections. Between those scheduled visits, fugitive emissions or equipment issues can go undetected for days or weeks, creating a gap that carries real safety, environmental, and financial risk.
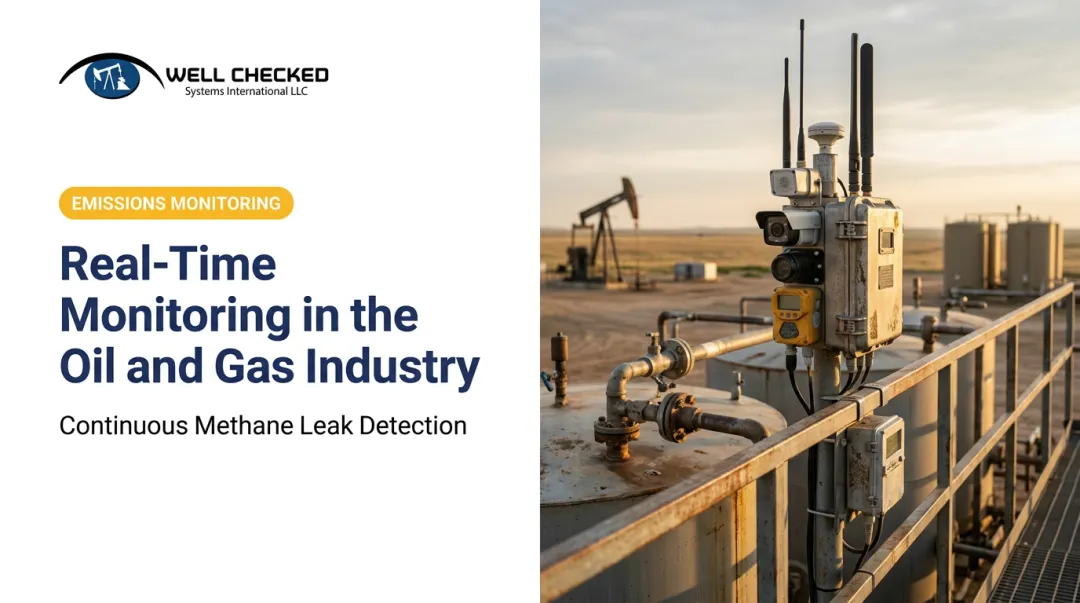
This is the exact problem Well Checked Systems' Zensory.ai™ platform was built to solve. Instead of a technician driving out to a site once a quarter, the system provides continuous, autonomous field awareness through three sensor types working together:
- Sight — high-resolution video with AI object detection, analyzing over 1,500 videos per site, per day
- Sound — acoustic anomaly AI that identifies abnormal equipment noise signatures tied to mechanical malfunctions. Well Checked has a USPTO provisional patent filing covering its acoustic anomaly detection technology.
- Gas imaging — Long-Wave Infrared Optical Gas Imaging that detects methane and VOC concentrations invisible to the naked eye
A Three-Tier Detection and Reporting Architecture
The platform splits responsibilities across three sequential tiers, so quantification is never wasted on false alarms:
| Layer | Function | Output |
|---|---|---|
| Zentinal Ops™ | Visual and acoustic equipment intelligence: high-resolution video, object recognition, acoustic anomaly detection | Actionable alerts |
| Zentinal Core™ | Multi-sensor autonomous detection; learns each site's normal baseline in about 2 days, then filters false alarms; supports OGMP 2.0 Level 3 | Validated fugitive-event alerts |
| Zentinal IQ™ | Fires only after Core validates an event; quantifies volume, duration, and rate | Regulatory-defensible compliance reports |
This sequencing matters. Rather than treating every signal as suspicious, the system finds what the platform describes as the needle in stacks of needles — flagging genuine anomalies while letting normal process emissions pass without triggering an alert.

Built for Remote, Low-Connectivity Sites
Onsite edge computing lets the system operate independently of network connectivity, which is critical across remote basins where cellular or broadband access is unreliable. Data queues locally and syncs automatically once a connection is restored.
This architecture is already running at scale. Well Checked Systems monitors remote wellsites, including a confirmed multi-site deployment across the Appalachian Basin. Availability extends into the Permian, Anadarko, Bakken, Eagle Ford, Denver-Julesburg, and San Juan basins.
Regulatory Impact
The real-time approach supports EPA methane rule alternative-monitoring pathways under Subpart OOOOb, along with OGMP 2.0 Level 4/5 reporting.
The system also enables an acknowledge-dispatch-mitigate response within 24 hours of a validated event. That window produces a documented response for methane survey events, compared to the weeks-long detection gaps common with quarterly LDAR cycles.
Best Practices for Implementing a Real-Time Monitoring System
Deploying sensors is the easy part. Getting value out of them requires some upfront discipline.
- Define specific goals and metrics before deployment. Decide what "actionable" looks like for your operation before data starts flowing. Otherwise, you'll drown in numbers that don't drive decisions.
- Choose scalable, flexible tools. Systems that integrate with existing incident management, dashboards, and reporting workflows, including SCADA feeds, avoid creating yet another isolated data silo.
- Set clear alert thresholds and response procedures. Google's SRE team recommends paging only on conditions that require human judgment and immediate action, such as a confirmed methane leak — everything else belongs on a dashboard, not in someone's inbox.
Skipping any of these steps is how organizations end up with expensive sensor networks that generate alerts nobody trusts enough to act on.
Frequently Asked Questions
What are the types of real-time monitoring?
The main categories are IT/network infrastructure, industrial/IoT equipment, environmental/emissions, security and surveillance, application/digital experience, and business/financial monitoring. Each uses different sensors but shares the same goal: catching events as they happen.
How does a real-time monitoring system work?
Sensors collect data at the source, which is transmitted (often via edge computing) to a processing layer for analysis. Validated anomalies then trigger alerts, while dashboards display live and historical data for decision-making.
What is the difference between real-time monitoring and traditional periodic monitoring?
Real-time monitoring provides continuous, low-latency visibility, while periodic monitoring only checks conditions at scheduled intervals. That gap between checks is exactly where undetected leaks, failures, or outages tend to occur.
What industries rely most on real-time monitoring systems?
IT and cloud infrastructure, healthcare, manufacturing, security, and oil and gas/energy are among the heaviest adopters. Each industry applies the concept differently, but all share the same need to catch problems before they escalate.
How does real-time monitoring help with regulatory compliance in oil & gas?
Continuous emissions data creates timestamped, auditable records that support EPA Subpart OOOOb alternative-monitoring pathways and OGMP 2.0 reporting. This closes the gaps left by quarterly LDAR inspections with defensible, ongoing documentation.
Is real-time monitoring expensive to implement for industrial operations?
There's upfront investment in sensors and software. However, it typically replaces recurring, route-based inspection costs — which run $1 million to $5 million or more annually for mid-sized to large operators — making it a cost offset, not an added expense.