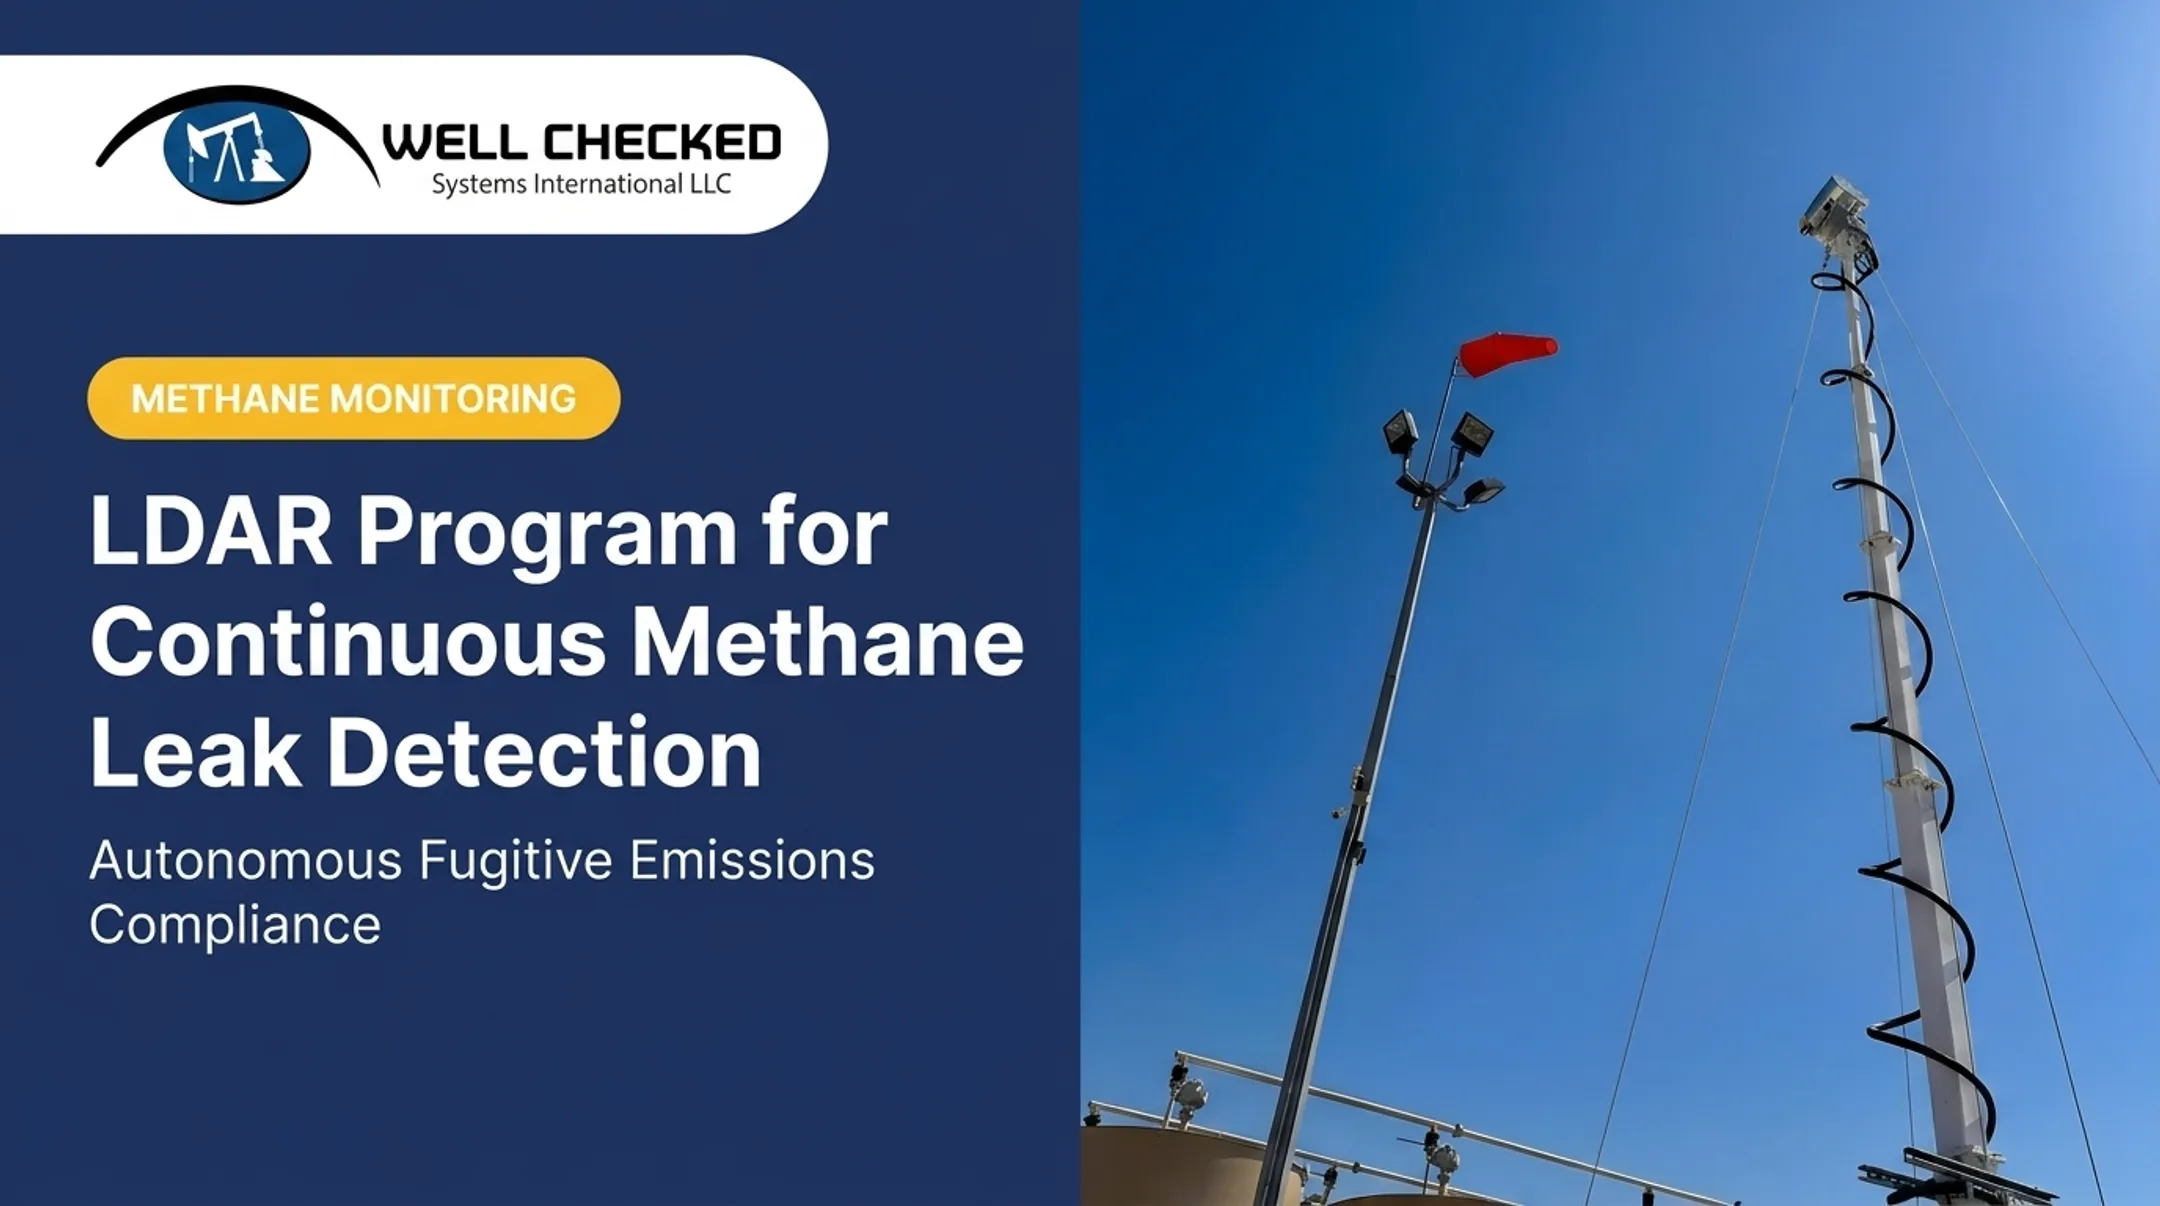
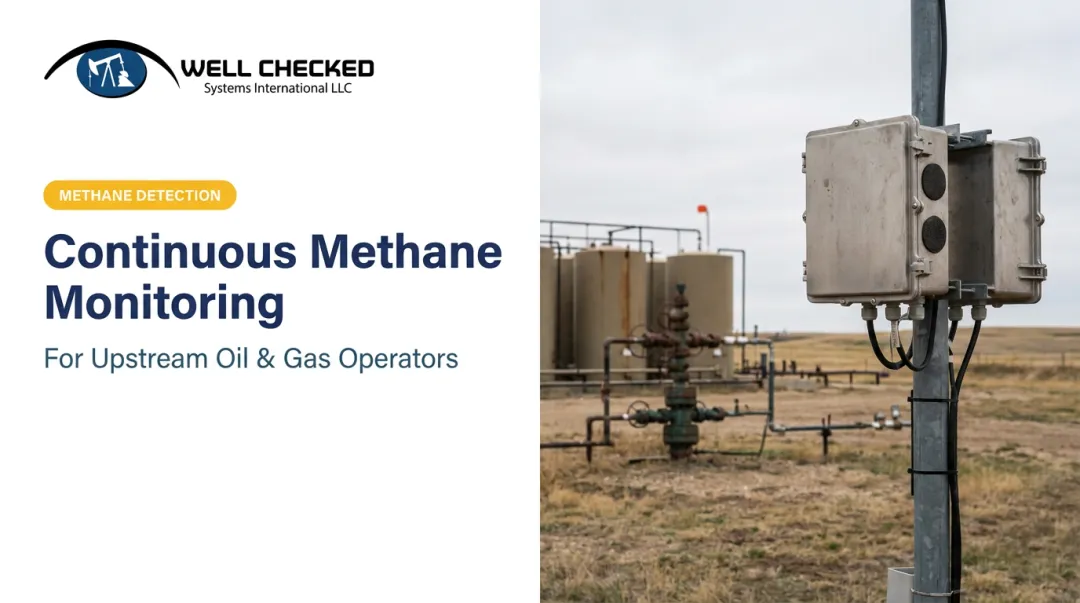
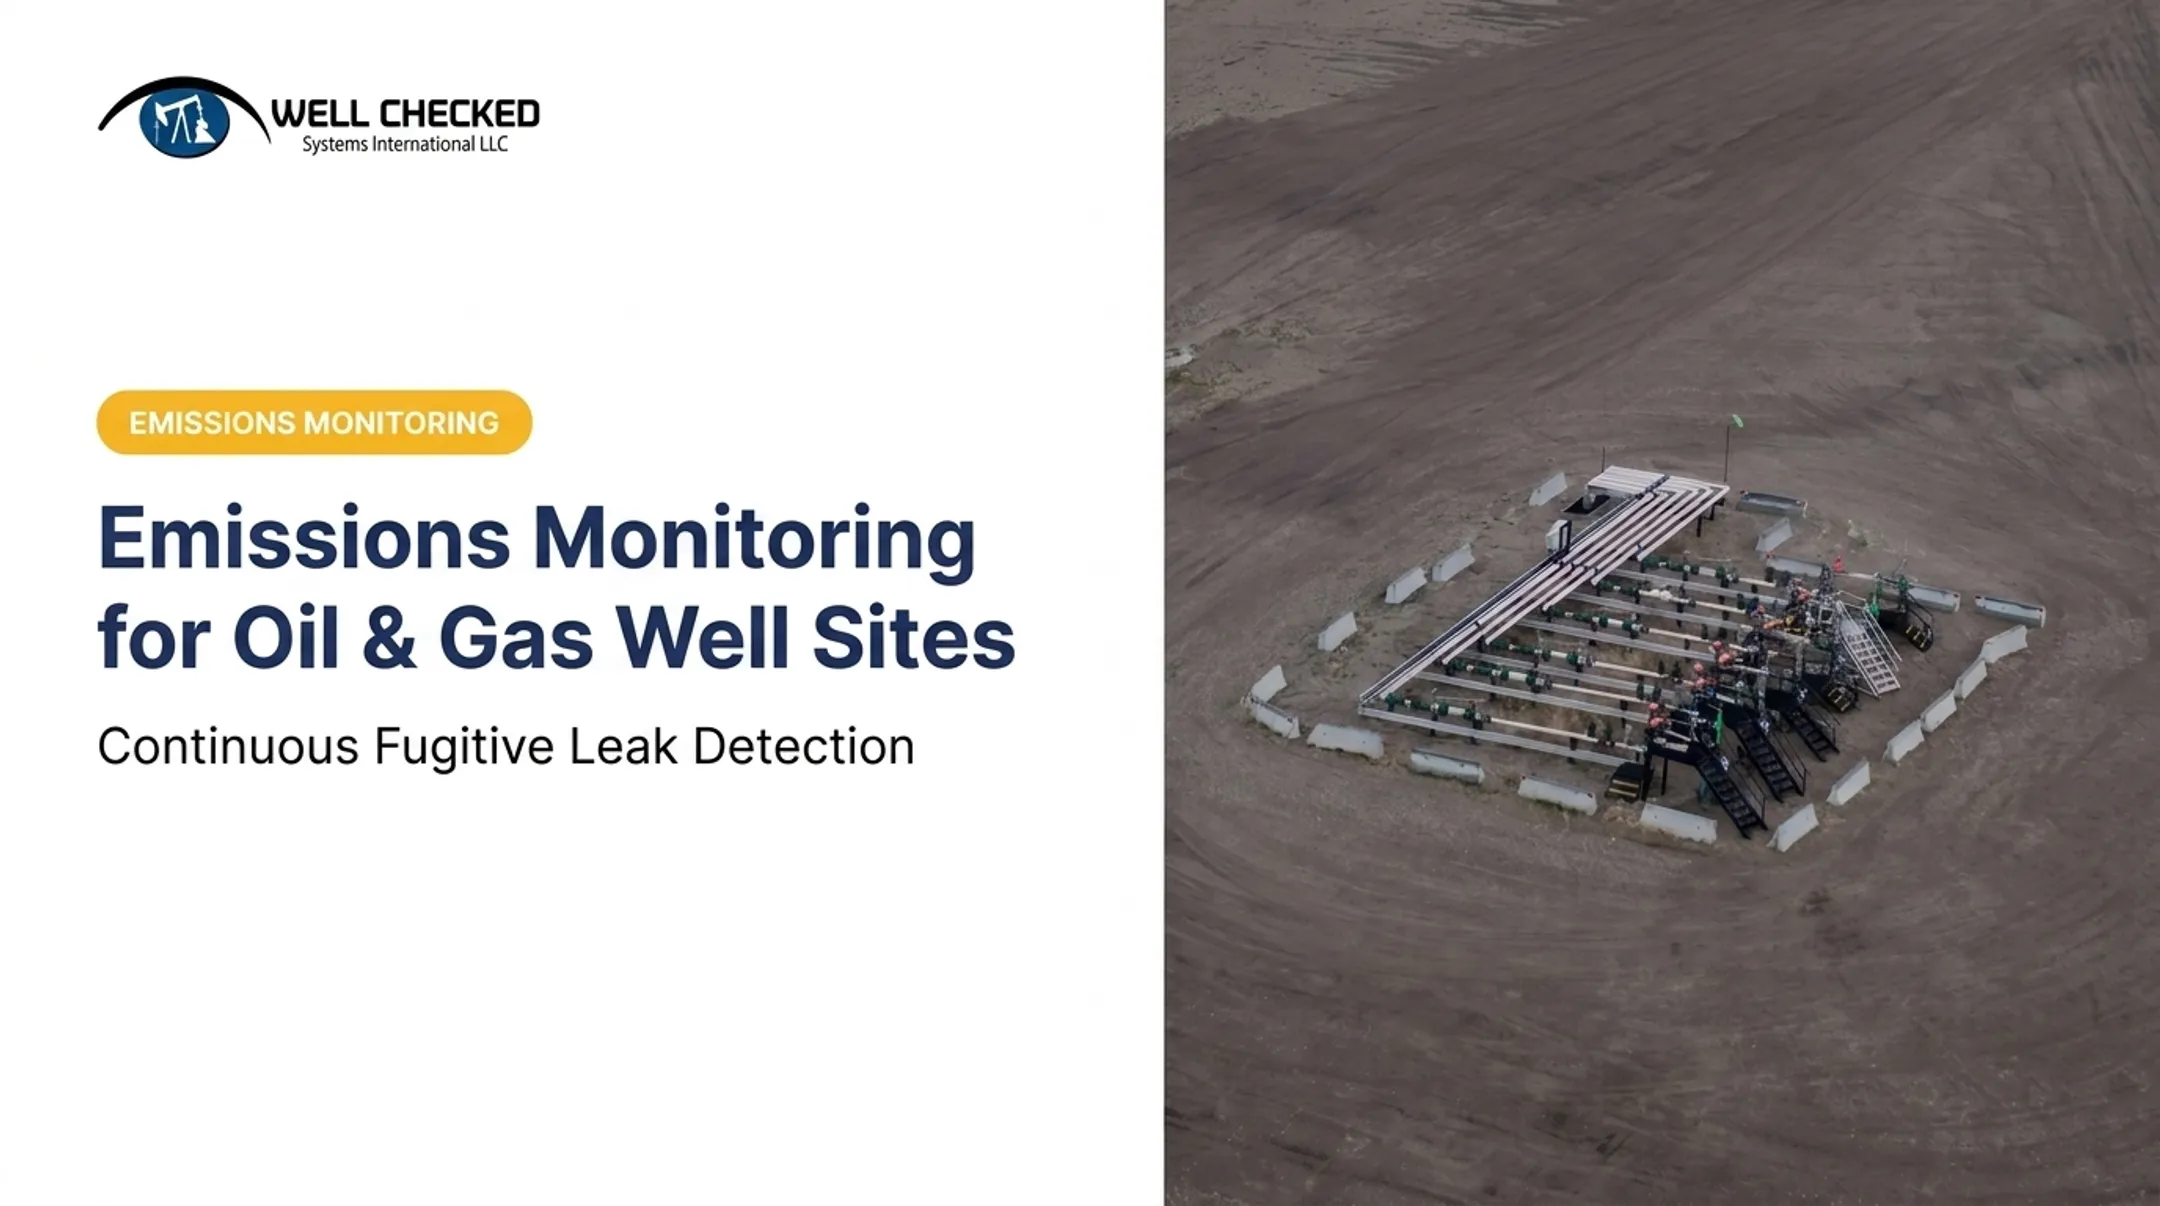
For decades, US upstream operators relied on pumper routes and quarterly LDAR inspections to catch leaks. That model has a fundamental flaw: it only sees the site during the visit. Everything that happens between visits stays invisible, until someone shows up weeks or months later.
The EPA's methane rule and mounting ESG reporting pressure are pushing the industry toward something different: continuous, sensor-based monitoring that watches sites around the clock. This guide breaks down the technologies, the trade-offs, and how to evaluate a solution for your portfolio.
Key Takeaways
- Continuous monitoring closes the detection gap quarterly LDAR surveys leave open
- Multi-sensor fusion (optical, acoustic, infrared) cuts false alarms so teams operate by exception
- EPA's Subpart OOOOb and OGMP 2.0 are accelerating demand for measurement-based, defensible data
- Choose by site count, false-alarm tolerance, and SCADA/integration needs—not sensor count alone
Why Continuous Methane Monitoring Matters Now
Leaks aren't evenly distributed. A 2022 peer-reviewed study of US low-production well sites found that roughly 50% of cumulative methane emissions came from just the top 5% of sites: the "super-emitters." Quarterly surveys aren't built to catch that kind of intermittent, high-volume event fast.
The financial exposure is real. Route-based pumper visits cost mid-to-large operators an estimated $1 million to $5 million-plus annually, according to Well Checked's operational data across its customer base. That figure covers labor, vehicles, mobilization, and follow-up surveys, not the fines that follow a missed leak.
There's also a safety dimension that rarely makes it into the ROI spreadsheet:
- Reduced pumper travel means less exposure to traffic accidents and adverse weather
- Fewer site visits to remote, hazardous locations (H2S, confined spaces, unstable terrain)
- Lower vehicle-mile totals, which also cut fuel and vehicle maintenance spend

Continuous monitoring doesn't just find leaks faster. It gets people out of harm's way.
Continuous Monitoring vs. Traditional LDAR: A Practical Comparison
Traditional LDAR programs run on five best-practice elements, per EPA's LDAR Best Practices Guide:
- Identifying components
- Defining what counts as a leak
- Monitoring at required intervals
- Repairing on schedule
- Recordkeeping
It's a solid framework, but it has a built-in blind spot: the gap between survey dates.
Continuous monitoring doesn't replace that framework. It changes the monitoring step. Fixed sensors watch the site nonstop, so an event that would sit undetected for weeks under quarterly LDAR can trigger an alert within hours.
Detection Latency, Precision, and Cost
| Factor | Traditional LDAR | Continuous Monitoring |
|---|---|---|
| Detection window | Quarterly/annual | Hours (site-level) |
| Spatial precision | Component-level | Area/site-level, needs follow-up OGI for exact component |
| Cost structure | Per-visit labor + travel | Upfront/subscription + lower ongoing labor |
| Regulatory status | Long-established | Requires EPA-approved alternative-monitoring pathway |

Most operators run both. Continuous sensors raise the alarm; a targeted OGI survey pinpoints the exact leaking component and confirms the repair. Neither fully replaces the other. Alerts still need investigation, repair, and verification.
Well Checked's Zensory.ai™ platform combines video, LWIR optical gas imaging, and acoustic sensing to track site activity continuously, with each site establishing its own operating baseline within about two days.
Core Technologies Powering Continuous Monitoring Solutions
Optical Gas Imaging and LWIR Cameras
OGI cameras visualize methane plumes that are invisible to the naked eye. Long-wave infrared (LWIR) systems work day and night and typically run at roughly one-third the cost of traditional mid-wave IR systems — a meaningful difference when you're scaling across dozens or hundreds of sites.
Acoustic Anomaly Detection
Acoustic sensors listen for abnormal equipment sounds that often signal a leak or malfunction before it shows up visually. A change in a compressor's hum or a hiss that shouldn't be there can catch problems other sensors miss.
Fixed Point Sensors and IoT Gas Detectors
Point sensors measure concentration continuously and, combined with wind data, help narrow down where an emission is coming from. They're strong on persistence, weaker on pinpoint localization without a downwind sensor in the right spot.
AI and Machine Learning
Filtering noise is the hardest problem in continuous monitoring. Normal flaring, venting, and process activity can look like a leak to a naive sensor. AI models solve this through a site-learning cycle: Zentinal Core™, for example, spends roughly two days observing a new site to build a baseline of normal behavior before it starts flagging true anomalies.
Satellite and Aerial Monitoring
Satellites and drones add basin-wide or verification-level coverage. They're useful for prioritizing where to look, but they trade sensitivity and precision for scale, which is why they work best as a complementary layer, not a standalone solution.
Leak Rate Quantification
Detecting a leak is step one. Knowing how much gas is escaping, and how fast, determines whether a repair is urgent or can wait. Quantification converts concentration and imaging data into a mass/time leak-rate estimate, which then feeds directly into repair-priority and ROI decisions.

How to Evaluate and Choose a Continuous Monitoring Solution
Before signing a contract, push vendors on these criteria:
- False-alarm filtering accuracy — Ask for real performance data, not lab numbers. METEC's controlled-release testing found detection and false-positive rates varying wildly between systems, some over 79% false-positive under certain conditions.
- Sensor redundancy — Sight, sound, and gas detection working together catch more leaks and reduce single-point failure.
- Edge computing reliability — Remote wellsites lose connectivity. The system needs to keep working and sync later.
- SCADA/ops integration — Look for a published API that supports alert delivery and data export, not a closed system.
Regulatory-defensible output matters as much as detection. Data needs to be structured for EPA submissions, OGMP 2.0, SASB, and TCFD, not just a dashboard screenshot.
Response workflow matters too. An acknowledge-dispatch-mitigate cycle within 24 hours of a validated event is the target window that minimizes both wasted gas and fine exposure.
If you operate across multiple basins, confirm the solution scales without reinventing the deployment process at every new site.
Regulatory and ESG Reporting Considerations
EPA's 40 CFR Part 60 Subpart OOOOb allows approved alternative-monitoring pathways in place of standard AVO/OGI schedules. A system still needs that specific approval — commercial availability alone does not qualify it.
OGMP 2.0 pushes further into measurement. Level 4 requires source-level, measurement-based quantification. Level 5 reconciles that data against site-level measurement. That is a real shift from the estimate-based inventories most operators have used for years.
Publicly traded E&Ps also face growing pressure to produce:
- SASB-aligned methane percentage and Scope 1 emissions data
- TCFD-style governance and risk disclosures for investors
Regulators and investors want the same thing: measurement-based data with an auditable trail, not a spreadsheet built on assumptions. Continuous monitoring platforms that quantify validated emissions — including Well Checked's Zentinal IQ™ — are built to feed EPA alternative-monitoring, OGMP 2.0 Level 4/5, SASB, and TCFD reporting with defensible records.
How Well Checked Delivers Autonomous, Regulatory-Defensible Monitoring
Well Checked's Zensory.ai™ platform delivers autonomous monitoring in three tiers that take operators from site awareness to defensible emissions data:
- Zentinal Ops™ — visual and acoustic intelligence with high-resolution video, object detection, and acoustic anomaly monitoring
- Zentinal Core™ — multi-sensor emissions detection that filters false alarms and alerts only on true fugitive events
- Zentinal IQ™ — quantifies validated events for regulatory-defensible reporting aligned with EPA Subpart OOOOb, OGMP 2.0, SASB, and TCFD
The stack runs on patented infrared imaging and machine learning, plus an acoustic anomaly algorithm first built for compressors. Each site completes a roughly two-day AI site learning cycle that separates normal process behavior from genuine leaks, supported by 1,500+ videos analyzed per site, per day.

That model runs at scale in the Appalachian Basin.
Frequently Asked Questions
How much does a methane detector cost?
Portable handheld analyzers start at a few thousand dollars. Fixed continuous multi-sensor systems with quantification cost more, though LWIR-based systems run roughly one-third the price of traditional mid-wave IR equipment.
What is the difference between continuous monitoring and LDAR?
LDAR checks individual components on a quarterly or annual cadence, while continuous monitoring watches the whole site around the clock. Most operators use both: continuous sensors raise the alarm, and LDAR surveys pinpoint the leaking component.
Can continuous monitoring replace periodic leak surveys entirely?
In some cases, yes, it can serve as an EPA-recognized alternative-monitoring pathway under Subpart OOOOb. In practice, it's often paired with targeted OGI surveys to confirm the exact leaking component and verify repairs.
How does AI reduce false alarms in methane monitoring?
AI systems run a site-learning cycle, typically a couple of days, to build a baseline of normal operations. Once that baseline exists, the system can flag genuine deviations instead of mistaking routine venting or flaring for a leak.
What data do regulators require for methane emissions reporting?
EPA's Subpart OOOOb, OGMP 2.0, SASB, and TCFD all push toward measurement-based, auditable emissions data rather than estimates. That means volume, duration, and rate records tied to validated events, not just periodic snapshots.