The global anomaly detection market is forecast to hit $14.59 billion by 2030, growing at a 16.5% CAGR from 2023 according to Grand View Research. That growth reflects a real shift: organizations are drowning in continuous data streams and need automated systems to flag exceptions.
But here's the problem many teams run into. They deploy anomaly detection tools without understanding how the underlying methods work. The result? Wrong algorithm for the data type, thresholds set poorly, and teams flooded with false alarms until they stop trusting the system entirely.
This guide breaks down what anomaly detection actually is, how it works step-by-step, and where it delivers measurable value.
Key Takeaways
- Anomaly detection flags data points or behaviors that deviate from expected patterns
- Three core types exist: point, contextual, and collective anomalies
- Methods range from basic statistics to machine learning and deep learning
- Catches fraud, stops cyber threats, flags clinical risks, and surfaces equipment failures in industrial operations
- AI-driven approaches cut false positives and support real-time response
What Is Anomaly Detection?
Anomaly detection is the process of identifying data points, events, or observations that deviate from expected or normal behavior. The academic definition, from Chandola, Banerjee, and Kumar's widely-cited survey, describes it as defining a "normal region" and flagging anything outside it as anomalous.
Manual review of continuous data streams — transactions, sensor feeds, network logs, video — simply isn't feasible at scale. No team can eyeball a continuous video feed from every wellsite. Automation fills that operational gap.
Anomaly detection is not the same as basic outlier removal. Outlier removal typically strips one-off data errors from a dataset before analysis. Anomaly detection is a broader operational workflow: it models normality, scores deviations, sets alert thresholds, and routes flagged events to a human or automated response.
As data volumes keep climbing, this distinction matters more. It lets organizations act on exceptions instead of reviewing everything.
Method choice depends heavily on data type:
- Statistical methods — good for simple, well-understood tabular data
- Machine learning — better for complex, high-dimensional, or streaming data
- Deep learning — suited to sensor/time-series or image/audio data with non-linear patterns
Types of Anomalies
Recognizing which type of anomaly you're dealing with is a prerequisite to picking the right detection method. Get this wrong and even a well-tuned model will miss the pattern it was built to catch.
Point Anomalies
A single data point that differs significantly from the rest of the dataset. A methane spike of 50,000 ppm on a pad that normally reads near ambient is a classic point anomaly — no context needed, it just stands out.
Contextual Anomalies
Data that looks normal in isolation but abnormal within a specific context, like time or operating conditions. A compressor running loud at startup is normal; the same sound level three hours into steady-state operation might indicate a problem. Context decides whether that reading is normal process noise or a real event.
Collective Anomalies
A group of related data points that are jointly anomalous even though each looks fine individually. A sequence of small pressure fluctuations, none alarming on its own, can together indicate equipment degrading toward failure. This is where sequence and ordering matter more than any single reading.

How Does Anomaly Detection Work?
Anomaly detection systems follow a defined sequence from data ingestion to flagged output. Understanding each stage clarifies where things typically break down.
Initiation: Data Collection & Baseline Learning
The process starts with continuous data collection — transactions, sensor readings, network traffic, video, or audio — and building a baseline of what "normal" looks like in that environment. Baseline learning happens two ways:
- Unsupervised: the model discovers patterns on its own from raw historical data
- Supervised: the model trains on labeled historical examples of normal and abnormal behavior
"Normal" is rarely static. A wellsite's acoustic profile shifts across seasons and operating cycles, so a baseline built under one condition can misfire under another.
Core Operation: Pattern Comparison & Scoring
Incoming data gets continuously compared against the learned baseline. Depending on the method, the model calculates a deviation or anomaly score using statistical distance, density estimation, or reconstruction error.
This stage directly determines three performance variables:
- Detection speed: how quickly each score is computed
- Sensitivity: where the alert threshold sits
- Accuracy: how cleanly real anomalies separate from normal variation
Regulation: False-Positive Filtering
This is the most underrated stage. Systems apply thresholds, contextual rules, or multi-sensor correlation to separate noise from genuine anomalies. Continuous recalibration limits model drift as normal behavior shifts over time.
Skip it, and teams get flooded with false alarms. NIST's intrusion-detection research describes the same failure mode: excessive alerts that demand heavy tuning before operators can trust them. Once trust erodes, response stops. That is alert fatigue, and it defeats the system.
Output: Alerting & Response
The final output is a flagged event, anomaly score, or classification passed to a human reviewer or automated response system. That signal feeds downstream workflows: investigations, maintenance dispatch, or compliance reporting.
When output is clean, teams respond faster, miss fewer real incidents, and spend less time chasing false alarms.

Is AI Used in Anomaly Detection?
Yes. AI and machine learning are now central to modern anomaly detection, particularly for complex, high-volume, or multi-sensor data. But AI is one family of methods within the discipline, not a synonym for it.
Three main learning approaches dominate:
| Approach | Data assumption | Best fit |
|---|---|---|
| Supervised | Labeled normal and anomaly examples | Reliable labels available; watch for class imbalance with rare events |
| Unsupervised | No labels at all | Pattern discovery in unfamiliar data |
| Semi-supervised | Labeled "normal" data only | Scarce incident data, anomalies inferred as deviations |
Neural networks and autoencoders excel at multi-sensor, non-linear pattern recognition. They combine visual, acoustic, and gas-imaging streams into one coherent picture rather than treating each stream in isolation.
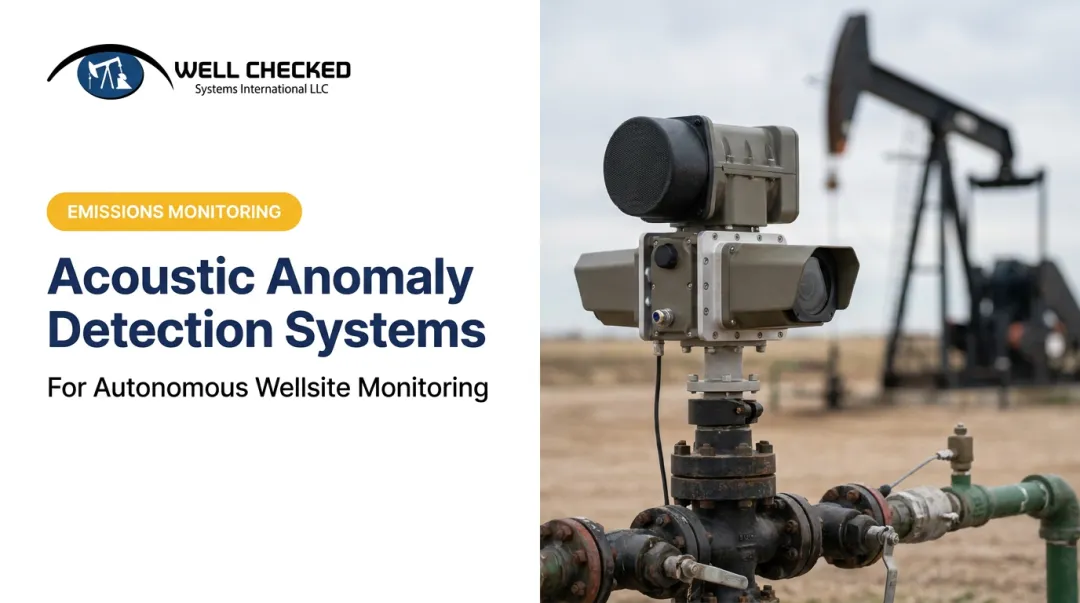
Well Checked Systems' Zensory.ai™ platform is a working example of this in an industrial setting. Its patented acoustic anomaly detection algorithm learns normal operational sound patterns at each wellsite through an AI Site Learning process that runs roughly two days per site.
Once that baseline is set, the system flags genuine fugitive emission events while filtering out the noise of normal process activity, instead of overwhelming field teams with every unusual sound.
If the site configuration changes, the platform re-learns the baseline rather than forcing operators to manually retune it.

Where Is Anomaly Detection Used?
Anomaly detection fits naturally into continuous monitoring workflows: transactions, network traffic, equipment sensors, or video/audio feeds, all flagged in real time for exceptions. It performs best in high-volume, continuous-stream environments where manual review simply isn't scalable. Industry applications vary in what they're watching for:
- Finance — fraud detection across transaction streams, where rare-event class imbalance is a persistent challenge
- Cybersecurity — intrusion detection based on deviations from normal user, host, or network profiles
- Healthcare — patient monitoring for irregular vital signs or unusual record-access patterns
- Oil & gas — emissions and equipment monitoring, where multi-sensor systems help operators shift from routine site visits to working "by exception" In oil and gas, Well Checked's Zentinal Core™ platform shows this shift in practice. It combines high-resolution video, Long-Wave Infrared Optical Gas Imaging, and acoustic AI across remote wellsites. Rather than treating every sensor blip as suspicious, Core validates events against the site's learned baseline before alerting. That filters the "needle in stacks of needles" so operators aren't buried in noise. Once Core validates a fugitive emissions event, Zentinal IQ™ quantifies volume, duration, and release rate for regulatory-defensible reporting aligned with EPA Subpart OOOOb and OGMP 2.0 frameworks. Operators can then acknowledge, dispatch, and mitigate within 24 hours of a validated event, instead of waiting for the next scheduled lease operator route or quarterly inspection.

Conclusion
Anomaly detection, stripped down to its mechanics, works the same way everywhere: learn normal patterns, score deviations, filter out noise, and output an actionable alert. The domain (fraud, network security, patient vitals, wellsite emissions) changes the data and the stakes, not the underlying pipeline.
Selecting the right technique for your data type, and building in proper false-positive filtering, directly affects detection accuracy. It also determines whether your team trusts and acts on the alerts it receives.
Frequently Asked Questions
How does anomaly-based detection work?
It compares incoming data against a learned baseline of normal behavior and flags significant deviations using statistical or machine learning scoring. Scores then pass through thresholds before an alert fires.
What are the three types of anomalies?
Point anomalies are single unusual values, such as a sudden methane spike. Contextual anomalies look normal overall but wrong for the time or operating state. Collective anomalies are sequences of normal points that are abnormal together, like degrading equipment readings.
Can AI be used for anomaly detection?
Yes. Machine learning and deep learning methods, including autoencoders and isolation forests, handle complex, multi-sensor, or non-linear patterns that simple statistical thresholds miss.
What are the three main types of ML models used in anomaly detection?
Supervised models train on labeled normal and anomalous data. Unsupervised models find patterns without labels. Semi-supervised models train mainly on labeled normal data and treat deviations from that baseline as anomalies.
What is the difference between anomaly detection and outlier detection?
Outlier detection typically addresses individual extreme values in a dataset. Anomaly detection is broader, covering point, contextual, and collective pattern-based deviations across continuous data streams.
How accurate is AI-powered anomaly detection compared to traditional methods?
AI methods generally reduce false positives and adapt better to complex, multi-variable patterns than static statistical thresholds. Accuracy still depends heavily on data quality, labeling, and proper model tuning.