That's not just a climate problem. It's lost revenue, EPA fine exposure under the tightening methane rule, and growing scrutiny from investors tracking ESG performance. The good news: most of this loss is preventable. It's not a fixed cost of doing business — it's a detection and monitoring gap.
This article breaks down where methane emissions actually originate, what drives an operator's emissions profile, and the practical strategies — equipment, operations, and monitoring — that reduce losses in the field.
Key Takeaways
- Fugitive leaks, venting, and flaring waste salable gas and create climate liability for upstream operators.
- Quarterly manual inspections routinely miss leaks that emerge and persist between visits.
- Meaningful cuts come from layering equipment upgrades, operational changes, and continuous monitoring.
- Continuous AI monitoring is replacing quarterly LDAR routes as EPA Subpart OOOOb tightens detection and quantification.
Where Methane Emissions Come From in Oil and Gas Operations
Methane loss falls into three buckets: fugitive leaks from equipment and connections, vented emissions from pneumatic devices and tanks, and flaring inefficiencies where combustion doesn't fully convert methane.
EPA's 2022 production-sector data breaks down the major sources like this:
| Source | Share of Emissions |
|---|---|
| Pneumatic controllers | 33% |
| Gas engines | 15% |
| Compressors | 11% |
| Equipment leaks | 9% |
| Storage tanks | 8% |
| Produced water | 5% |
| Pneumatic pumps | 4% |

Common hardware culprits include:
- Compressor seals and valves
- Connectors and storage tank hatches
- Pneumatic controllers that bleed gas by design
Here's the tricky part: many of these releases aren't constant. They're intermittent and episodic, triggered by a malfunctioning controller, a liquids unloading event, or a valve that starts leaking after a workover. And most leaks are invisible and odorless. Without infrared imaging or acoustic sensing, they simply go unnoticed.
That detection gap is driving regulatory change. EPA's 40 CFR Part 60 Subpart OOOOb now requires facility-specific monitoring frequencies: quarterly optical gas imaging for multi-wellhead sites, and bimonthly for major production facilities. Operators need continuous-capable detection, not only periodic snapshots.
Key Drivers That Determine an Operator's Methane Emissions Profile
Not every site emits the same way. A handful of factors shape an operator's baseline emissions risk:
- Equipment age and design. Older, poorly maintained pneumatic controllers and compressors leak more. Field studies find emissions at roughly 75% of low-production sites; the top 5% account for about half the total loss.
- Monitoring method and frequency. Whether you use quarterly manual routes or continuous sensing determines how fast a leak gets caught. A leak that starts the day after an operator visit can run undetected for months.
- Site remoteness. Logistics matter. A leak flagged at a remote wellsite still needs a technician to travel, confirm, and repair it. Distance and workforce availability directly affect response time.
- Regulatory and reporting frameworks. State-level rules, OGMP 2.0, and SASB/TCFD disclosure expectations are steadily raising what counts as "acceptable" performance, pushing measurement-based reporting over estimates.

Age alone doesn't predict emissions. A well-maintained older site can outperform a newer one with deferred maintenance. Ranking sites by measured loss, not just equipment vintage, is the more reliable approach.
Strategies to Reduce Methane Emissions in Oil and Gas
Cutting emissions effectively means addressing three layers together: what equipment you run, how you operate day-to-day, and how you monitor for problems.
Strategies Through Equipment and Design Choices
- Replace high-bleed pneumatic controllers with low- or zero-emission alternatives, or convert to instrument air. EPA notes instrument-air conversions can save up to 70,000 Mcf per facility annually.
- Install vapor recovery units on storage tanks. EPA reports VRUs typically capture vapor at 0.25-2 psig with recovery rates around 95% when properly powered and maintained.
- Prioritize leakless valves and connectors during new well development or workovers, targeting known leak points like flanges and threaded connections.
- Improve flare design and combustion efficiency to reduce unburned methane slip during venting and flaring events.
Strategies Through Better Monitoring and Management
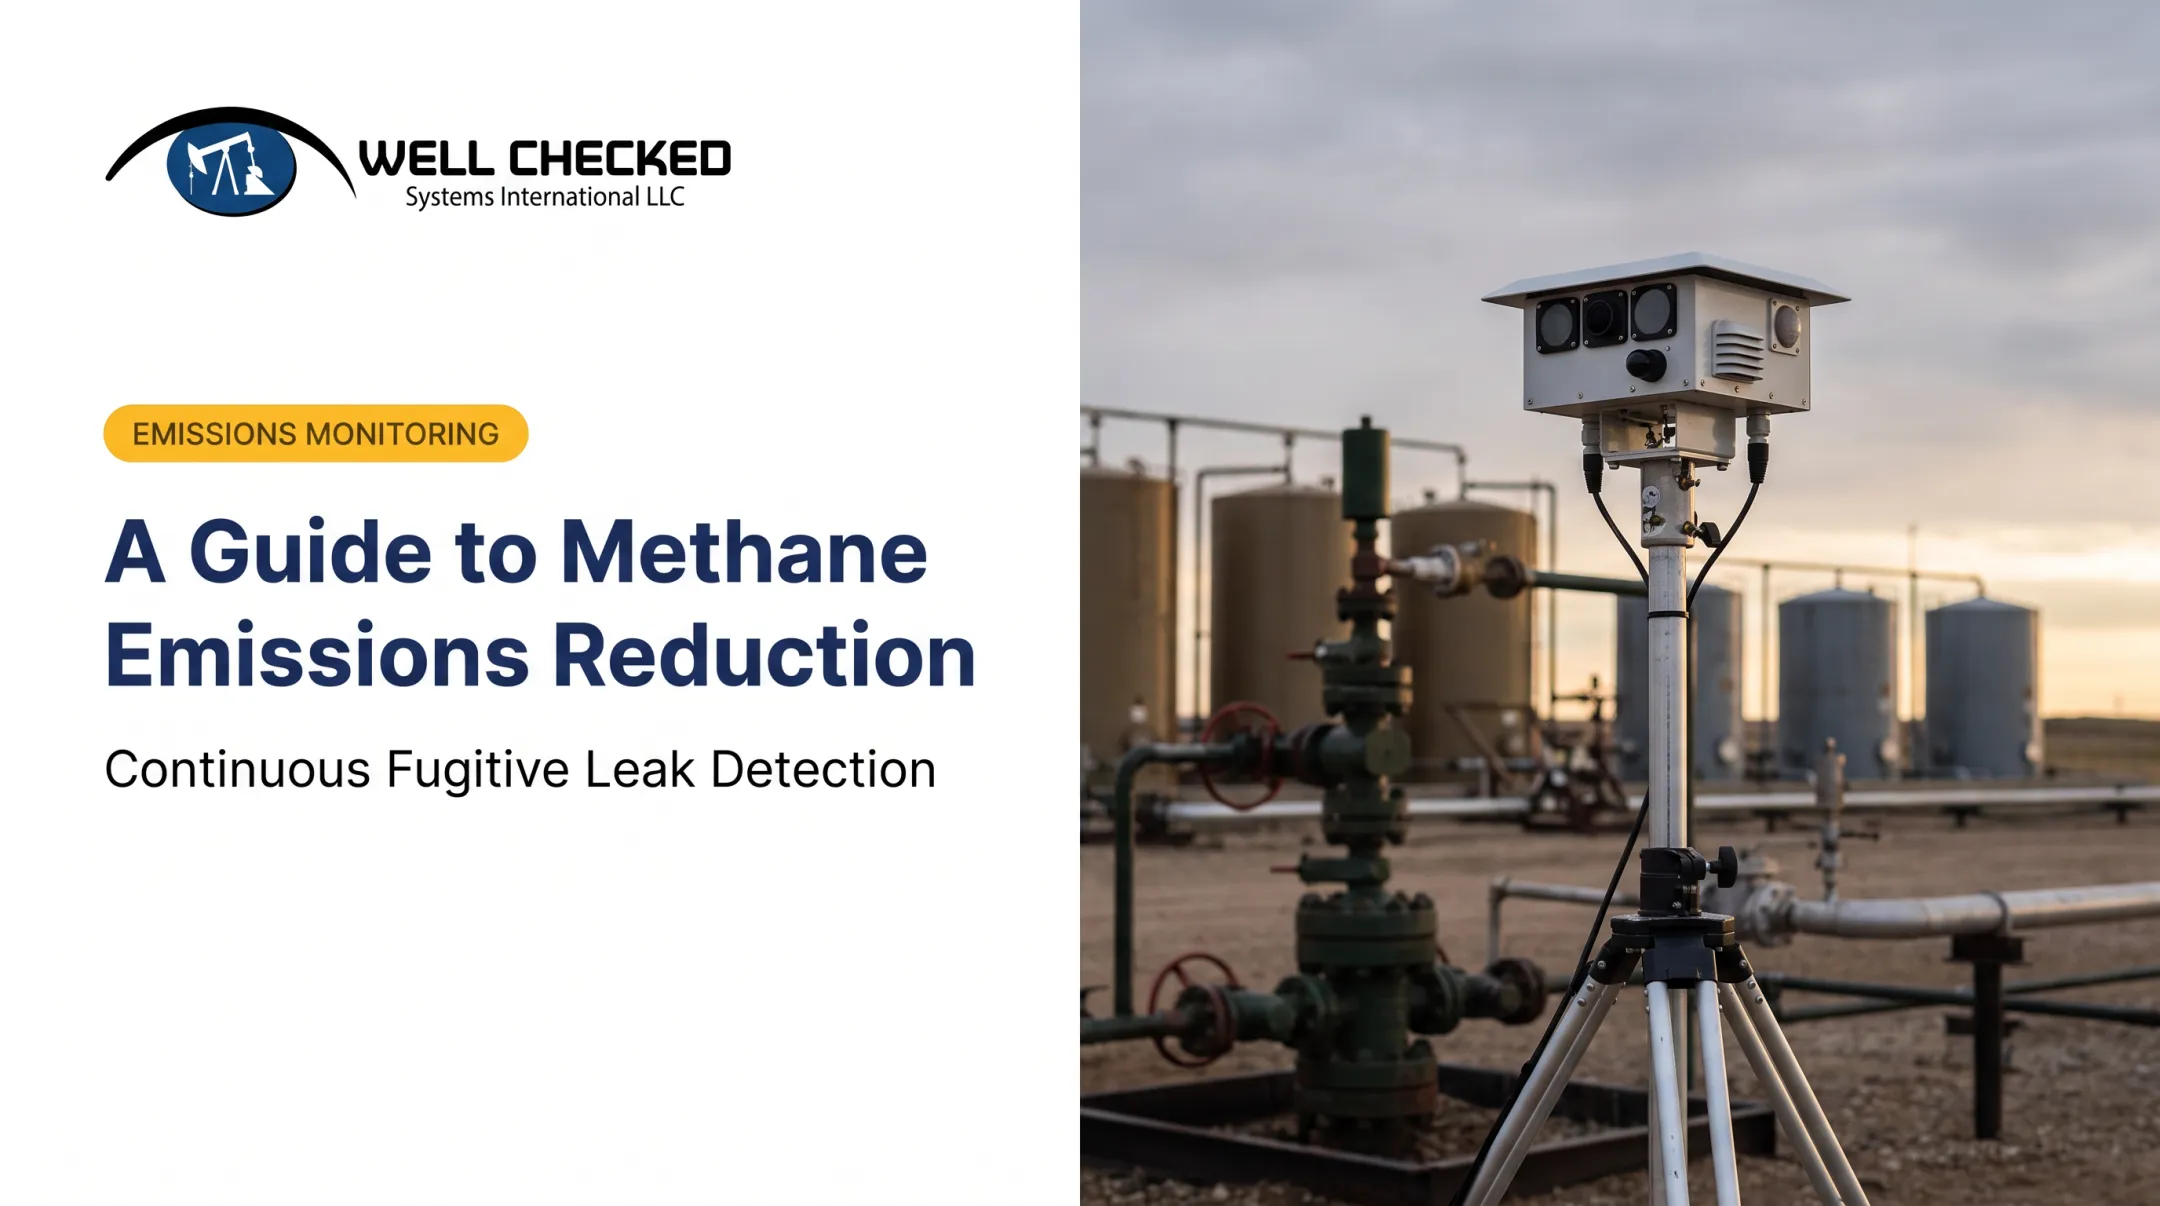
Periodic LDAR inspections (quarterly walkthroughs with a handheld optical gas imaging camera) only capture a snapshot. A leak that starts the week after an inspection can run for months before anyone notices. Continuous, multi-sensor monitoring closes that gap. This is where Well Checked Systems' Zensory.ai™ platform fits in. It combines high-resolution video, Long-Wave Infrared optical gas imaging, and acoustic sensing to give operators continuous visibility into fugitive emissions at remote wellsites, without needing a truck on-site to catch a problem. The platform's Zentinal Core™ layer runs an AI Site Learning cycle (roughly two days per site) to establish what "normal" operations look like across video, sound, and gas-imaging streams. Once that baseline is set, it can flag genuine anomalies instead of burying field teams in false alarms tied to routine flaring, venting, or equipment noise. Independent research on continuous monitoring systems has found false-positive rates ranging from 0% to 79% across different technologies. Filtering out that noise is what makes continuous monitoring operationally practical rather than exhausting. Clear response protocols matter as much as detection. Well Checked's workflow supports an acknowledge-dispatch-mitigate sequence designed to get validated events addressed within a 24-hour window, limiting both gas loss and fine exposure.

Strategies That Change the Operational Context
Sometimes the equipment isn't the problem; the surrounding process is.
- Electrify or consolidate pneumatic systems using instrument air instead of natural gas where power infrastructure allows.
- Automate liquids unloading with plunger lift or velocity string systems. Research on 107 US wells found automated triggering averaged just 1,260 scf per event, versus 21,000-35,000 scf for wells without plungers at all.
- Standardize monitoring across multi-basin portfolios. Inconsistent inspection cadence between basins creates uneven emissions performance that's hard to defend to regulators or investors. In many cases, it's the inspection cadence and logistics, not the hardware itself, driving excess emissions.

How Continuous Monitoring Supports Regulatory Compliance and ROI
Quantified, continuous emissions data does more than catch leaks faster. It also builds the defensible record operators need for regulators and ESG disclosures.
- Regulatory alignment: Timestamped emissions data supports EPA's OOOOb alternative-monitoring pathway and OGMP 2.0 Level 4/5 reporting that reconciles source-level estimates with site measurements.
- Repair-vs-replace decisions: Duration and volume data (not just detection) help operators decide whether a quick repair or a full equipment swap makes more financial sense.
- Cost offset potential: Gas that would otherwise vent or leak can be captured and sold, offsetting monitoring costs over time.
Zentinal IQ™ is built for this layer: it quantifies validated events into EPA-format logs, OGMP 2.0-aligned reports, and CSV/JSON exports for ESG teams working under SASB and TCFD frameworks.
Conclusion
Reducing methane emissions starts with knowing where they actually originate: aging equipment, operational blind spots, and gaps in inspection frequency. Bolting on a single fix rarely works. Effective reduction blends equipment upgrades, smarter operational practices, and continuous monitoring infrastructure.
As the EPA's OOOOb rule and ESG reporting standards keep tightening, treating emissions monitoring as an ongoing capability, not a quarterly checkbox, is now baseline practice for operators who need defensible results.
Frequently Asked Questions
What is the main source of methane emissions in oil and gas operations?
Fugitive leaks from equipment and connections, venting from pneumatic devices and tanks, and incomplete flaring are the primary sources across production and midstream operations. EPA data shows pneumatic controllers alone account for roughly a third of production-segment emissions.
How can oil and gas companies reduce methane emissions?
The main levers are equipment upgrades (low-bleed controllers, vapor recovery units), operational changes (automated liquids unloading, instrument air conversion), and continuous monitoring that catches leaks faster than quarterly inspections.
What is the EPA methane rule for oil and gas?
40 CFR Part 60 Subpart OOOOb, effective May 2024, sets emission standards and monitoring frequencies for new, modified, and reconstructed oil and gas sources.
How is methane detected at oil and gas sites?
Common methods include optical gas imaging cameras, acoustic sensing, handheld Method 21 detectors, and aerial or satellite surveys. Continuous multi-sensor systems increasingly combine several of these methods for faster detection.
Is reducing methane emissions cost-effective for operators?
Captured methane that would otherwise vent or leak can be sold as natural gas, helping offset monitoring and repair costs. Route-based inspection programs alone can cost mid-sized to large operators $1 million to $5 million or more annually.
What is OGMP 2.0 and how does it relate to methane reporting?
OGMP 2.0 is a voluntary framework that progresses operators from basic estimated inventories (Level 1-3) to source-level measurement (Level 4) and site-level measurement reconciliation (Level 5). Operators increasingly target Level 4/5 as investor and regulatory scrutiny grows.