That gap is expensive. Published industry downtime research finds that unplanned downtime costs the world's 500 largest companies 11% of revenue, or $1.4 trillion annually, a figure that reflects how much operators lose when problems go undetected between checks. published 2024 industry downtime-cost research makes clear this isn't a niche problem.
Real-time equipment monitoring solves this by using sensors to continuously collect data from machines and assets, feeding it into software that analyzes conditions instantly and flags problems as they happen, not weeks later.
This article covers how the technology works, the main sensor types available, the operational benefits, how "real-time" differs from "continuous" monitoring, and a real-world example from upstream oil and gas.
Key Takeaways
- Continuous sensors replace scheduled site visits with instant analysis
- Vibration, thermal, acoustic, and gas-imaging sensors each catch different failure signatures
- Edge computing keeps detection running despite remote connectivity loss
- Alert filtering matters as much as sensor coverage itself
- Operators are already replacing pumper routes with exception-based monitoring
What Is Real-Time Equipment Monitoring and How Does It Work?
Real-time equipment monitoring uses sensors mounted on or near critical assets to capture data continuously and analyze it the moment it arrives. Compare that to route-based inspection, where a technician visits on a fixed schedule (weekly, monthly, quarterly) and collects a single snapshot.
Fluke's own comparison of the two approaches notes that online condition monitoring tracks equipment health around the clock, while handheld route tools only capture data during scheduled visits.
Sensors used in real-time systems typically measure:
- Vibration for rotating equipment stress
- Temperature for overheating or thermal drift
- Pressure for fluid system anomalies
- Optical/imaging for visual or gas-based leak detection
- Acoustic signals for abnormal sound patterns
The Four-Step Real-Time Monitoring Cycle
Every real-time system, regardless of industry, runs on the same basic loop:
- Measure — Sensors capture raw physical, optical, or acoustic data directly from the asset.
- Transmit — That data moves via wireless gateway, cellular network, or wired connection to an edge device or cloud platform.
- Analyze — Software compares incoming readings against an established baseline of normal operation to flag deviations.
- Act — The system generates an alert and, in integrated setups, automatically creates a work order or triggers a response workflow.

Skip any one of these steps and you don't have real-time monitoring anymore. You have a sensor dumping data nobody's watching.
Why Edge Computing Matters for Remote or Hazardous Assets
Oil fields, pipelines, and offshore rigs don't always have reliable internet. That's where onsite edge computing comes in: it lets a system detect anomalies and generate alerts locally, without waiting on a connection to a distant server.
Deloitte describes this as the "intelligent edge," combining local computing, AI, and connectivity to act on data closer to where it's generated.
Before any of this works, though, the system needs to learn what "normal" looks like at a given site. Well Checked Systems' Zensory.ai™ platform, for instance, runs an AI Site Learning cycle of approximately two days per site before it starts reliably distinguishing routine operations from true anomalies. That's a short runway considering how much variation exists between wellsites.
Types of Real-Time Equipment Monitoring
Most sources group monitoring into a few broad categories: condition or health monitoring, performance monitoring, and multi-sensor detection monitoring. In practice, though, what matters more is the specific sensing method deployed, since each one catches different failure modes.
Vibration Monitoring
Rotating equipment (motors, pumps, compressors) produces a characteristic vibration signature. Fluke's analysis identifies four faults responsible for the vast majority of rotating-machine failures, each showing up as a distinctive spectral pattern:
- Misalignment between coupled shafts
- Imbalance in rotating components
- Looseness in mounts or fasteners
- Bearing wear from fatigue or contamination
This is why vibration sensors remain a staple on any asset with moving parts.
Thermal and Optical Gas Imaging Monitoring
Infrared sensors detect overheating before it becomes a fire risk. A more specialized application, optical gas imaging (OGI), uses long-wave infrared cameras to visually detect methane and volatile organic compound (VOC) leaks, day or night.
The EPA's Appendix K standard requires qualifying OGI cameras to detect 19 grams per hour of methane, within a defined operating envelope covering wind speed and viewing distance, according to EPA's technical fact sheet on optical gas imaging.
Long-wave infrared (LWIR) cameras also cost roughly one-third what traditional mid-wave infrared systems run, which is part of why continuous OGI has become more economically viable for operators managing large multi-site portfolios.
Acoustic and Ultrasonic Monitoring
Sound-based sensors pick up abnormal equipment noise and high-frequency stress waves, often catching a developing leak or fault before other sensors register anything.
Well Checked's acoustic anomaly AI, for example, builds a site-specific baseline in roughly two days and flags any deviation as a possible malfunction indicator, cross-checking it against video and infrared data to confirm the signal is real. Well Checked has a USPTO provisional patent filing covering its acoustic anomaly detection technology.
Electrical Current and Pressure/Flow Monitoring
Current draw on a motor can reveal a developing electrical or mechanical fault before it fails outright. Pressure and flow sensors, meanwhile, catch leaks, blockages, or cavitation in fluid systems, often showing up as erratic gauge readings paired with a shifted vibration signature.
Key Benefits of Real-Time Equipment Monitoring
The case for real-time monitoring isn't theoretical. Operators who've adopted it report measurable gains across several fronts.
- Reduced unplanned downtime — Catching a developing fault early means a scheduled repair instead of an emergency shutdown. A McKinsey-documented offshore program achieved a 20% average downtime reduction across nine platforms after roughly two years of investment, per McKinsey's maintenance digitization case study.
- Lower operational costs — Traditional pumper routes cost mid-sized to large operators $1 million to $5 million or more annually, a cost continuous monitoring is designed to cut significantly.
- Improved worker safety — Fewer manual inspections in hazardous or remote locations means less technician exposure to traffic accidents, weather, and dangerous site conditions.
- Stronger regulatory defensibility — Continuous, timestamped data creates a full audit trail. Quarterly snapshot reports simply can't compete on that front.
- Faster root-cause analysis — Historical monitoring data helps teams pinpoint exactly why something failed, and whether a repair is worth the cost relative to the loss it prevents.

Real-Time vs. Continuous vs. Periodic Monitoring: What's the Difference?
These terms get used interchangeably, but they describe different things. Real-time refers to processing speed: how fast data gets analyzed and acted on. Continuous refers to collection frequency: whether data flows without gaps.
They often overlap, but a system can be continuous without being real-time. Data can pile up and get analyzed in batches later, rather than acted on as it arrives.
| Approach | Data Collection | Response Speed | Best-Fit Use Case |
|---|---|---|---|
| Real-time | Instant, as generated | Immediate | Safety-critical or regulatory-timed events |
| Continuous | Around the clock | Can vary | Long-term trend tracking, health monitoring |
| Periodic/route-based | Fixed intervals | Delayed until next visit | Low-risk, stable assets with predictable wear |
That distinction matters most for operators managing genuinely time-sensitive risks, such as a safety hazard or a regulatory response window: monitoring needs to be both continuous and processed in real time.
A system that collects data continuously but only analyzes it weekly defeats the purpose. So does one that processes in real time but checks in only quarterly. Zentinal Core™ closes this gap by combining continuous collection with real-time processing, rather than defaulting to one or the other.
Implementation Considerations: Choosing the Right System
Rolling out a monitoring system isn't just a matter of bolting sensors onto equipment. A few decisions determine whether it actually works in practice.
Match sensors and connectivity to site conditions. Legacy machinery and remote locations each present different constraints, and update speed varies dramatically by protocol. Published wireless protocol specifications illustrate the gap:
- WirelessHART supports updates as fast as one second
- LoRaWAN typically updates hourly or slower
Pick the wrong network for the required latency, and you've built a system that can't actually monitor in real time.
Address alert fatigue directly. A system that flags every minor fluctuation gets ignored within weeks. The goal is filtering normal operational noise so teams only respond to genuine anomalies. Well Checked's Zentinal Core™, for instance, builds a per-site baseline before it starts alerting, specifically to avoid flooding operators with signals that don't require action.
Integrate alerts into existing workflows. An alert sitting unread in a dashboard is worthless. Monitoring data needs to feed directly into maintenance systems, ERP platforms, or SCADA via API. That way, an insight converts into an actual work order or dispatch, not just a notification nobody sees.
Real-World Example: Real-Time Equipment Monitoring in Oil & Gas Operations
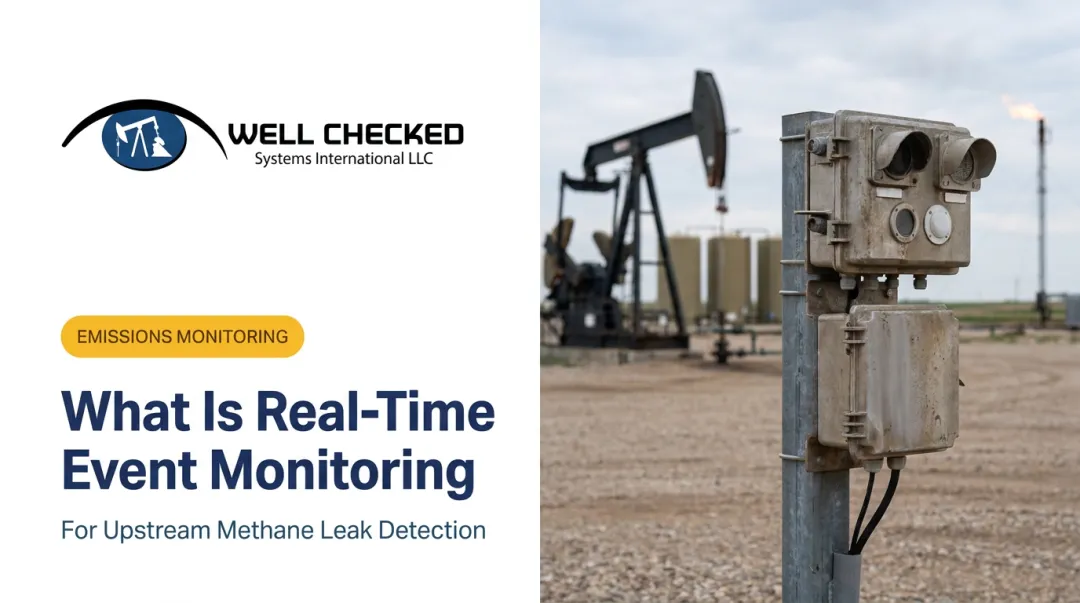
Upstream oil and gas operators have historically relied on "pumper routes," periodic drive-by visits to check wellsite equipment and look for leaks. Between visits, a leak or malfunction could run undetected for days or weeks.
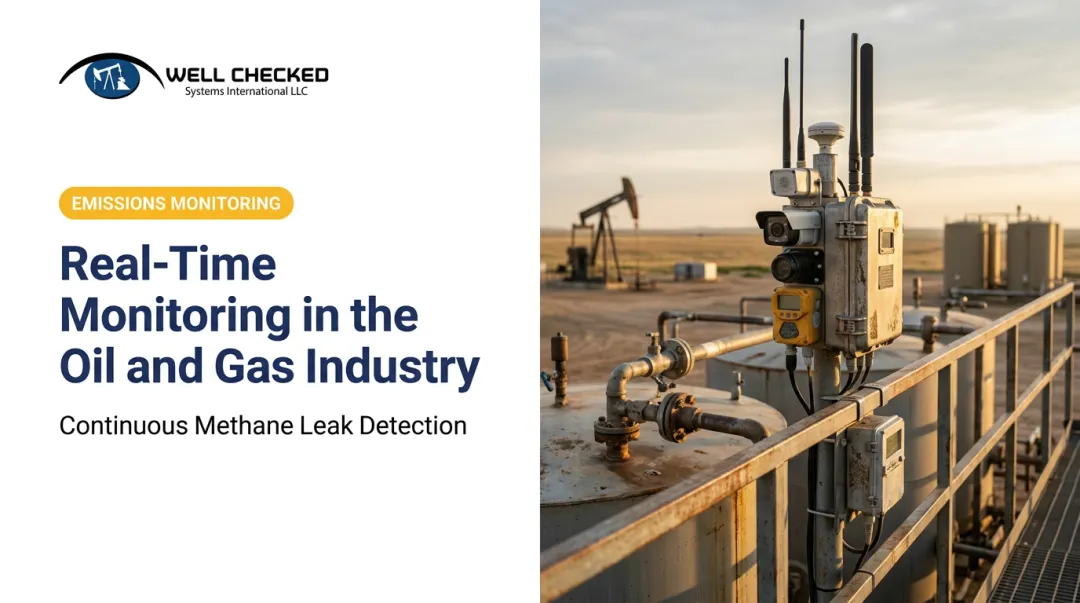
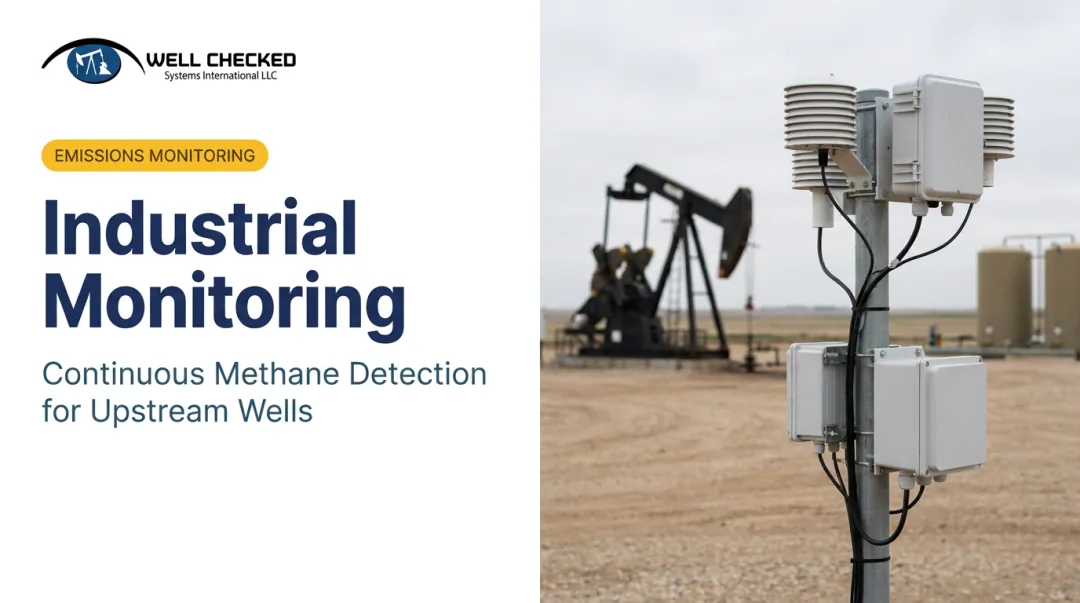
Well Checked Systems' Zensory.ai™ platform is a working example of what replaces that model. It combines three sensor types:
- High-resolution video with AI object detection
- Long-wave infrared optical gas imaging for methane and VOC leaks
- Acoustic anomaly AI for abnormal equipment sounds
The platform is currently deployed across remote wellsites, including a confirmed multi-site program in the Appalachian Basin. Onsite edge computing means detection continues even if a site loses internet or cellular connectivity, with data syncing automatically once the connection returns.

The bigger change here is operational. Instead of routine drive-by inspections, operators run on a monitor-by-exception model: field crews deploy only when the system validates a genuine event.
Once that happens, Well Checked's workflow supports an acknowledge-dispatch-mitigate response within 24 hours, a window documented to help support a documented, timely response on validated methane events. That shift supplements periodic snapshot reports with continuous, regulatory-defensible data.
Frequently Asked Questions
How does real-time equipment monitoring work?
Sensors continuously measure conditions like vibration, temperature, or gas presence, then transmit that data for instant analysis against a normal-operating baseline. Genuine deviations trigger an alert or automated work order right away.
What is the difference between real-time equipment monitoring and continuous monitoring?
Real-time describes how fast data gets processed, while continuous describes how consistently it's collected. A well-built system does both: gathering data without gaps and processing it immediately.
What is an example of real-time equipment monitoring?
A vibration sensor on a rotating pump that flags a bearing fault the moment its signature shifts is one example. Oil and gas wellsite monitoring using video, infrared, and acoustic equipment sensors together is another.
What are the three types of equipment monitoring?
Equipment monitoring generally falls into three categories: condition/health, performance, and multi-sensor detection monitoring. Others categorize by sensing method instead, such as vibration, thermal, or acoustic, which better reflects how systems are actually built.
What sensors are used in real-time equipment monitoring?
The most common are vibration, temperature/thermal, pressure, acoustic, and optical gas imaging sensors. Which combination makes sense depends on the equipment type and the failure modes you're trying to catch.
Is real-time equipment monitoring expensive to implement?
Costs vary based on sensor complexity and asset count, and can run into the millions for large-scale rollouts. That said, continuous monitoring typically offsets its own cost by reducing downtime, labor for site visits, and travel expenses over time.